Venezuela's crude oil production, 1973–2025
Venezuela pumped 3.4 million barrels a day in 1973, fell to 1.7 by 1985, climbed back to 3.2 in 1997, then collapsed: 0.53 million in 2020, 83% below its 1997 level.
What does this axis measure?
Oil output (million barrels a day)
What does this axis measure?
Year
Reveal the axesHide the axes
- y ↑
- Oil output (million barrels a day)
- x →
- Year
Show the story, the data and the sourceHide the story, the data and the source
The data: 40 points
| Year | Oil output (million barrels a day) |
|---|---|
| 1973 | 3.37 |
| 1974 | 2.98 |
| 1975 | 2.35 |
| 1977 | 2.24 |
| 1978 | 2.16 |
| 1979 | 2.36 |
| 1981 | 2.1 |
| 1982 | 1.89 |
| 1983 | 1.8 |
| 1985 | 1.68 |
| 1986 | 1.79 |
| 1987 | 1.75 |
| 1989 | 1.91 |
| 1990 | 2.14 |
| 1991 | 2.38 |
| 1993 | 2.31 |
| 1994 | 2.44 |
| 1995 | 2.75 |
| 1997 | 3.18 |
| 1998 | 3.12 |
| 1999 | 2.78 |
| 2001 | 2.81 |
| 2002 | 2.44 |
| 2003 | 2.3 |
| 2005 | 2.84 |
| 2006 | 2.79 |
| 2007 | 2.82 |
| 2008 | 2.51 |
| 2010 | 2.41 |
| 2011 | 2.5 |
| 2012 | 2.5 |
| 2014 | 2.5 |
| 2015 | 2.49 |
| 2017 | 2 |
| 2018 | 1.49 |
| 2019 | 0.88 |
| 2020 | 0.53 |
| 2022 | 0.72 |
| 2023 | 0.77 |
| 2025 | 0.97 |
- Ran in puzzle #28 on October 24, 2026. Play it
More like this
-
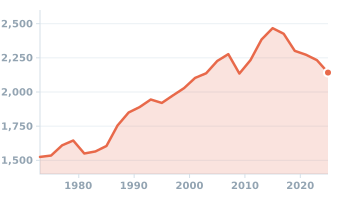 Median size of a new single-family house in the United States, 1973–2025
House size (square feet) ↑
Year →
-
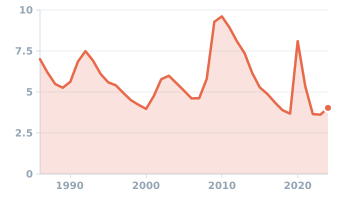 US unemployment rate, annual average, 1986–2024
Unemployment rate (%) ↑
Year →
-
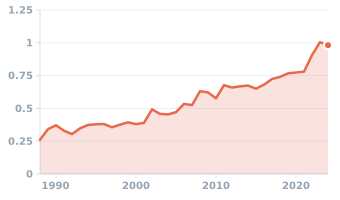 US price of a pound of potatoes, annual average, 1988–2024
Price ($/pound) ↑
Year →
-
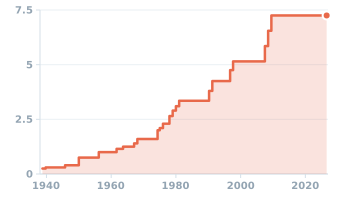 US federal minimum wage, not adjusted for inflation, 1938–2026
Wage ($/hour) ↑
Year →
-
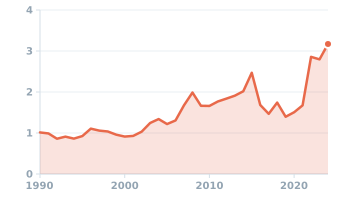 US price of a dozen eggs, annual average, 1990–2024
Price ($/dozen) ↑
Year →
-
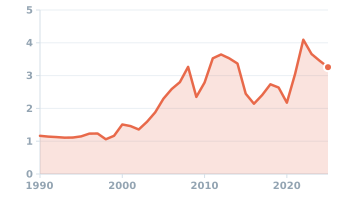 US price of regular gasoline, annual average, 1990–2025
Price ($/gallon) ↑
Year →