US price of a dozen eggs, annual average, 1990–2024
A dozen eggs averaged $1.01 in 1990. The dearest year so far was 2024, at $3.17.
What does this axis measure?
Price ($/dozen)
What does this axis measure?
Year
Reveal the axesHide the axes
- y ↑
- Price ($/dozen)
- x →
- Year
Show the story, the data and the sourceHide the story, the data and the source
The data: 35 points
| Year | Price ($/dozen) |
|---|---|
| 1990 | 1.014 |
| 1991 | 0.989 |
| 1992 | 0.86 |
| 1993 | 0.911 |
| 1994 | 0.863 |
| 1995 | 0.925 |
| 1996 | 1.106 |
| 1997 | 1.058 |
| 1998 | 1.037 |
| 1999 | 0.959 |
| 2000 | 0.913 |
| 2001 | 0.929 |
| 2002 | 1.032 |
| 2003 | 1.244 |
| 2004 | 1.34 |
| 2005 | 1.218 |
| 2006 | 1.306 |
| 2007 | 1.676 |
| 2008 | 1.987 |
| 2009 | 1.664 |
| 2010 | 1.66 |
| 2011 | 1.769 |
| 2012 | 1.838 |
| 2013 | 1.91 |
| 2014 | 2.018 |
| 2015 | 2.469 |
| 2016 | 1.684 |
| 2017 | 1.467 |
| 2018 | 1.742 |
| 2019 | 1.396 |
| 2020 | 1.506 |
| 2021 | 1.674 |
| 2022 | 2.857 |
| 2023 | 2.796 |
| 2024 | 3.171 |
- Ran in puzzle #7 on October 3, 2026. Play it
More like this
-
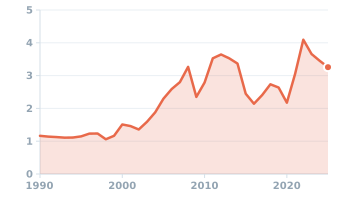 US price of regular gasoline, annual average, 1990–2025
Price ($/gallon) ↑
Year →
US price of regular gasoline, annual average, 1990–2025
Price ($/gallon) ↑
Year →
-
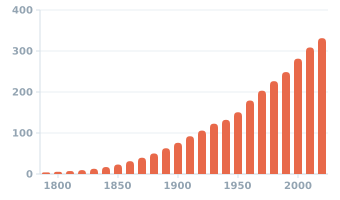 US population at each census, 1790–2020
Population (millions) ↑
Year →
US population at each census, 1790–2020
Population (millions) ↑
Year →
-
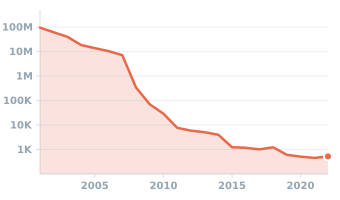 Cost of sequencing a human genome, 2001–2022
Cost per genome ($) ↑
Year →
Cost of sequencing a human genome, 2001–2022
Cost per genome ($) ↑
Year →
-
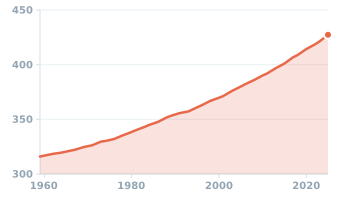 Atmospheric CO₂ at Mauna Loa, 1959–2025
CO₂ concentration (ppm) ↑
Year →
Atmospheric CO₂ at Mauna Loa, 1959–2025
CO₂ concentration (ppm) ↑
Year →
-
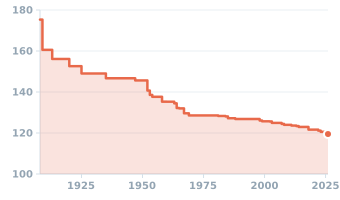 Men's marathon world record, 1908–2026
World record (minutes) ↑
Year →
Men's marathon world record, 1908–2026
World record (minutes) ↑
Year →
-
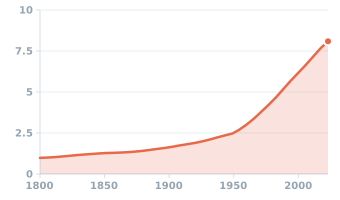 World population, 1800–2023
Population (billions) ↑
Year →
World population, 1800–2023
Population (billions) ↑
Year →