US unemployment rate, annual average, 1986–2024
The annual average peaked at 9.6% in 2010 and was lowest in 2023, at 3.6%.
What does this axis measure?
Unemployment rate (%)
What does this axis measure?
Year
Reveal the axesHide the axes
- y ↑
- Unemployment rate (%)
- x →
- Year
Show the story, the data and the sourceHide the story, the data and the source
The data: 39 points
| Year | Unemployment rate (%) |
|---|---|
| 1986 | 7 |
| 1987 | 6.18 |
| 1988 | 5.49 |
| 1989 | 5.26 |
| 1990 | 5.62 |
| 1991 | 6.85 |
| 1992 | 7.49 |
| 1993 | 6.91 |
| 1994 | 6.1 |
| 1995 | 5.59 |
| 1996 | 5.41 |
| 1997 | 4.94 |
| 1998 | 4.5 |
| 1999 | 4.22 |
| 2000 | 3.97 |
| 2001 | 4.74 |
| 2002 | 5.78 |
| 2003 | 5.99 |
| 2004 | 5.54 |
| 2005 | 5.08 |
| 2006 | 4.61 |
| 2007 | 4.62 |
| 2008 | 5.8 |
| 2009 | 9.28 |
| 2010 | 9.61 |
| 2011 | 8.93 |
| 2012 | 8.08 |
| 2013 | 7.36 |
| 2014 | 6.16 |
| 2015 | 5.28 |
| 2016 | 4.88 |
| 2017 | 4.36 |
| 2018 | 3.89 |
| 2019 | 3.68 |
| 2020 | 8.1 |
| 2021 | 5.35 |
| 2022 | 3.65 |
| 2023 | 3.62 |
| 2024 | 4.03 |
- Ran in puzzle #18 on October 14, 2026. Play it
More like this
-
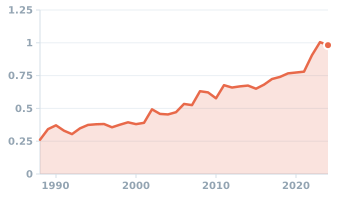 US price of a pound of potatoes, annual average, 1988–2024
Price ($/pound) ↑
Year →
US price of a pound of potatoes, annual average, 1988–2024
Price ($/pound) ↑
Year →
-
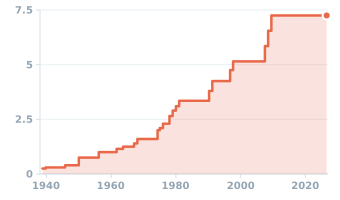 US federal minimum wage, not adjusted for inflation, 1938–2026
Wage ($/hour) ↑
Year →
US federal minimum wage, not adjusted for inflation, 1938–2026
Wage ($/hour) ↑
Year →
-
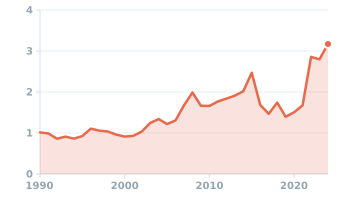 US price of a dozen eggs, annual average, 1990–2024
Price ($/dozen) ↑
Year →
US price of a dozen eggs, annual average, 1990–2024
Price ($/dozen) ↑
Year →
-
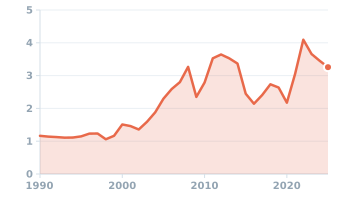 US price of regular gasoline, annual average, 1990–2025
Price ($/gallon) ↑
Year →
US price of regular gasoline, annual average, 1990–2025
Price ($/gallon) ↑
Year →
-
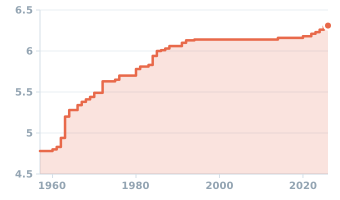 Men's pole vault world record, 1957–2026
Bar height (m) ↑
Year →
Men's pole vault world record, 1957–2026
Bar height (m) ↑
Year →
-
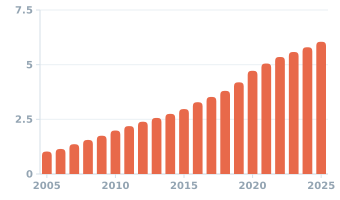 People using the internet worldwide, 2005–2025
Users (billions) ↑
Year →
People using the internet worldwide, 2005–2025
Users (billions) ↑
Year →