US price of regular gasoline, annual average, 1990–2025
The annual average peaked at $4.09 a gallon in 2022; the cheapest year of the period was 1998, at $1.06.
What does this axis measure?
Price ($/gallon)
What does this axis measure?
Year
Reveal the axesHide the axes
- y ↑
- Price ($/gallon)
- x →
- Year
Show the story, the data and the sourceHide the story, the data and the source
The data: 36 points
| Year | Price ($/gallon) |
|---|---|
| 1990 | 1.164 |
| 1991 | 1.14 |
| 1992 | 1.126 |
| 1993 | 1.108 |
| 1994 | 1.112 |
| 1995 | 1.147 |
| 1996 | 1.231 |
| 1997 | 1.234 |
| 1998 | 1.059 |
| 1999 | 1.165 |
| 2000 | 1.51 |
| 2001 | 1.461 |
| 2002 | 1.357 |
| 2003 | 1.591 |
| 2004 | 1.88 |
| 2005 | 2.295 |
| 2006 | 2.589 |
| 2007 | 2.801 |
| 2008 | 3.266 |
| 2009 | 2.35 |
| 2010 | 2.788 |
| 2011 | 3.527 |
| 2012 | 3.644 |
| 2013 | 3.526 |
| 2014 | 3.367 |
| 2015 | 2.448 |
| 2016 | 2.142 |
| 2017 | 2.407 |
| 2018 | 2.735 |
| 2019 | 2.636 |
| 2020 | 2.174 |
| 2021 | 3.05 |
| 2022 | 4.094 |
| 2023 | 3.658 |
| 2024 | 3.449 |
| 2025 | 3.257 |
- Ran in puzzle #2 on September 28, 2026. Play it
More like this
-
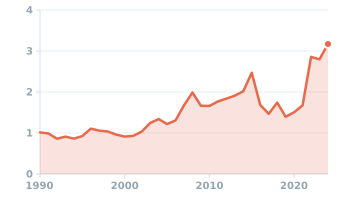 US price of a dozen eggs, annual average, 1990–2024
Price ($/dozen) ↑
Year →
US price of a dozen eggs, annual average, 1990–2024
Price ($/dozen) ↑
Year →
-
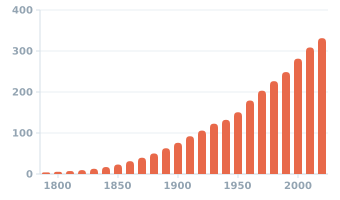 US population at each census, 1790–2020
Population (millions) ↑
Year →
US population at each census, 1790–2020
Population (millions) ↑
Year →
-
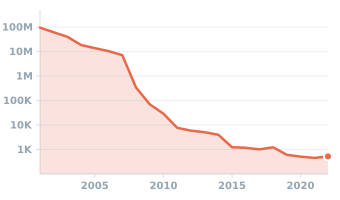 Cost of sequencing a human genome, 2001–2022
Cost per genome ($) ↑
Year →
Cost of sequencing a human genome, 2001–2022
Cost per genome ($) ↑
Year →
-
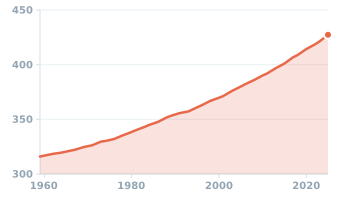 Atmospheric CO₂ at Mauna Loa, 1959–2025
CO₂ concentration (ppm) ↑
Year →
Atmospheric CO₂ at Mauna Loa, 1959–2025
CO₂ concentration (ppm) ↑
Year →
-
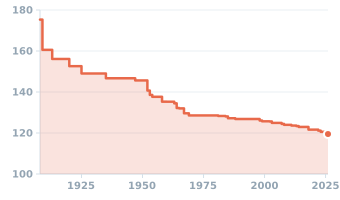 Men's marathon world record, 1908–2026
World record (minutes) ↑
Year →
Men's marathon world record, 1908–2026
World record (minutes) ↑
Year →
-
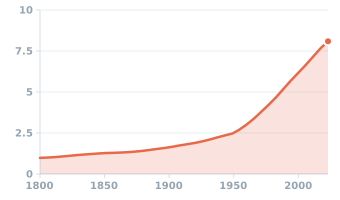 World population, 1800–2023
Population (billions) ↑
Year →
World population, 1800–2023
Population (billions) ↑
Year →