US bank prime loan rate, annual average, 1949–2025
The annual average peaked at 18.9% in 1981, then fell for decades; by 2025 it stood at 7.4%.
What does this axis measure?
Bank prime loan rate (%)
What does this axis measure?
Year
Reveal the axesHide the axes
- y ↑
- Bank prime loan rate (%)
- x →
- Year
Show the story, the data and the sourceHide the story, the data and the source
The data: 39 points
| Year | Bank prime loan rate (%) |
|---|---|
| 1949 | 2 |
| 1951 | 2.56 |
| 1953 | 3.17 |
| 1955 | 3.16 |
| 1957 | 4.2 |
| 1959 | 4.48 |
| 1961 | 4.5 |
| 1963 | 4.5 |
| 1965 | 4.54 |
| 1967 | 5.63 |
| 1969 | 7.95 |
| 1971 | 5.72 |
| 1973 | 8.02 |
| 1975 | 7.86 |
| 1977 | 6.82 |
| 1979 | 12.67 |
| 1981 | 18.87 |
| 1983 | 10.79 |
| 1985 | 9.93 |
| 1987 | 8.2 |
| 1989 | 10.87 |
| 1991 | 8.46 |
| 1993 | 6 |
| 1995 | 8.83 |
| 1997 | 8.44 |
| 1999 | 7.99 |
| 2001 | 6.92 |
| 2003 | 4.12 |
| 2005 | 6.19 |
| 2007 | 8.05 |
| 2009 | 3.25 |
| 2011 | 3.25 |
| 2013 | 3.25 |
| 2015 | 3.26 |
| 2017 | 4.1 |
| 2019 | 5.28 |
| 2021 | 3.25 |
| 2023 | 8.19 |
| 2025 | 7.37 |
- Ran in puzzle #30 on October 26, 2026. Play it
More like this
-
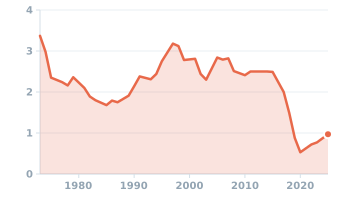 Venezuela's crude oil production, 1973–2025
Oil output (million barrels a day) ↑
Year →
-
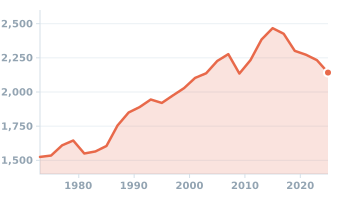 Median size of a new single-family house in the United States, 1973–2025
House size (square feet) ↑
Year →
-
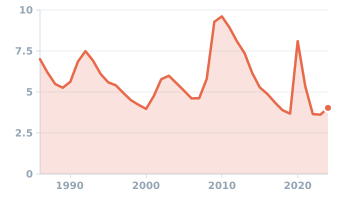 US unemployment rate, annual average, 1986–2024
Unemployment rate (%) ↑
Year →
-
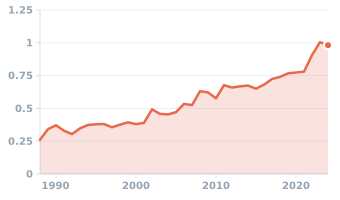 US price of a pound of potatoes, annual average, 1988–2024
Price ($/pound) ↑
Year →
-
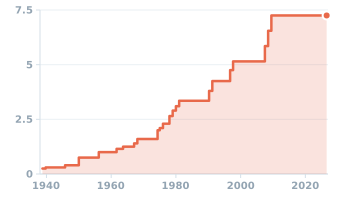 US federal minimum wage, not adjusted for inflation, 1938–2026
Wage ($/hour) ↑
Year →
-
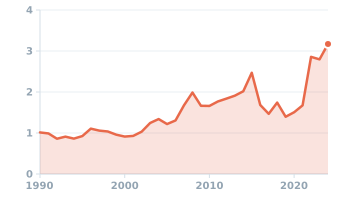 US price of a dozen eggs, annual average, 1990–2024
Price ($/dozen) ↑
Year →