Why a loss can feel bigger than a gain
In this fitted model, losing $100 counts 2.25 times as much as gaining $100. Each extra dollar makes less difference as the gain or loss grows.
What does this axis measure?
Perceived value (model units)
What does this axis measure?
Gain or loss ($)
Reveal the axesHide the axes
- y ↑
- Perceived value (model units)
- x →
- Gain or loss ($)
Show the story, the data and the sourceHide the story, the data and the source
The data: 21 points
| Gain or loss ($) | Perceived value (model units) |
|---|---|
| −100 | −129.473986 |
| −90 | −118.009216 |
| −80 | −106.39022 |
| −70 | −94.595133 |
| −60 | −82.595354 |
| −50 | −70.351947 |
| −40 | −57.808981 |
| −30 | −44.879625 |
| −20 | −31.411517 |
| −10 | −17.067995 |
| 0 | 0 |
| 10 | 7.585776 |
| 20 | 13.960674 |
| 30 | 19.9465 |
| 40 | 25.69288 |
| 50 | 31.267532 |
| 60 | 36.709046 |
| 70 | 42.042281 |
| 80 | 47.284542 |
| 90 | 52.448541 |
| 100 | 57.543994 |
- Ran in puzzle #54 on November 19, 2026. Play it
More like this
-
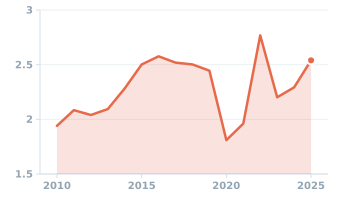 EU imports of men’s and boys’ jeans, 2010–2025
Import value (€ billions) ↑
Year →
-
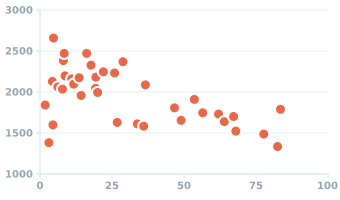 Hours worked in a year and output per hour of work, 40 countries, 2023
Working time (hours per year) ↑
Output per hour worked ($) →
-
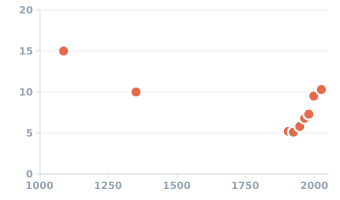 Woodland in England as a share of the land, 1086 to 2026
Woodland cover (% of land) ↑
Year →
-
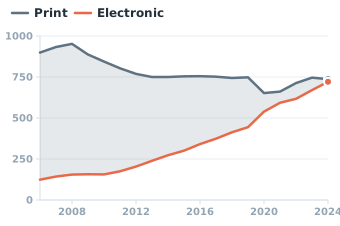 U.S. public libraries: print vs electronic materials spending, fiscal 2006–2024
Materials spending ($ millions) ↑
Year →
-
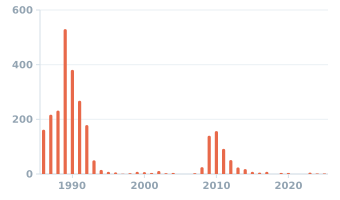 US bank failures by year, 1986–2025
Bank failures (count) ↑
Year →
-
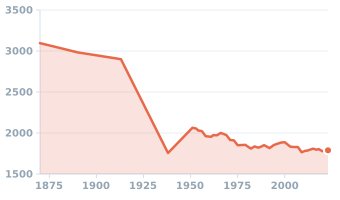 Hours worked per worker per year in the United States, 1870–2023
Working time (hours per year) ↑
Year →