Hours worked in a year and output per hour of work, 40 countries, 2023
In 2023 the average German worker put in 1,335 hours, the fewest of these 40 countries, and produced $82 an hour. In India: 2,383 hours and $8, in dollars of equal buying power.
What does this axis measure?
Working time (hours per year)
What does this axis measure?
Output per hour worked ($)
Reveal the axesHide the axes
- y ↑
- Working time (hours per year)
- x →
- Output per hour worked ($)
Show the story, the data and the sourceHide the story, the data and the source
The data: 40 points
| Output per hour worked ($) | Working time (hours per year) |
|---|---|
| 1.8 | 1841 |
| 3.1 | 1382 |
| 3.6 | 2128 |
| 4.3 | 2129 |
| 4.5 | 1599 |
| 4.7 | 2658 |
| 6.2 | 2062 |
| 7.7 | 2383 |
| 7.8 | 2035 |
| 8.1 | 2383 |
| 8.4 | 2471 |
| 8.7 | 2197 |
| 11 | 2160 |
| 11.7 | 2096 |
| 13.6 | 2174 |
| 14.3 | 1958 |
| 16.2 | 2471 |
| 17.7 | 2328 |
| 19 | 2177 |
| 19.3 | 2045 |
| 19.4 | 2181 |
| 20 | 1994 |
| 22 | 2246 |
| 25.9 | 2232 |
| 26.8 | 1629 |
| 28.8 | 2369 |
| 33.8 | 1612 |
| 36 | 1583 |
| 36.6 | 2087 |
| 46.7 | 1807 |
| 49 | 1654 |
| 53.6 | 1910 |
| 56.5 | 1747 |
| 62 | 1731 |
| 64 | 1638 |
| 67.2 | 1701 |
| 68 | 1523 |
| 77.7 | 1487 |
| 82.5 | 1335 |
| 83.5 | 1789 |
- Ran in puzzle #51 on November 16, 2026. Play it
More like this
-
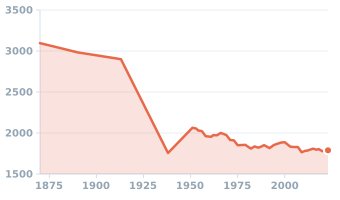 Hours worked per worker per year in the United States, 1870–2023
Working time (hours per year) ↑
Year →
-
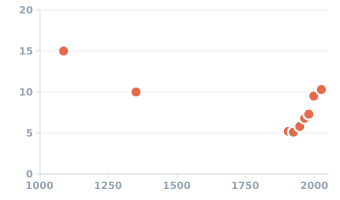 Woodland in England as a share of the land, 1086 to 2026
Woodland cover (% of land) ↑
Year →
-
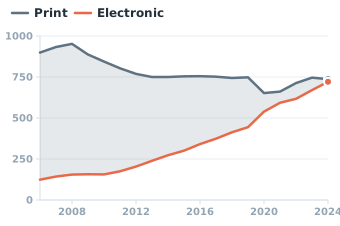 U.S. public libraries: print vs electronic materials spending, fiscal 2006–2024
Materials spending ($ millions) ↑
Year →
-
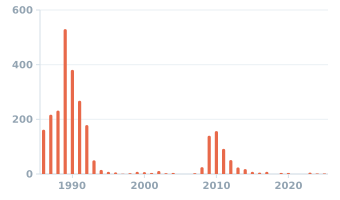 US bank failures by year, 1986–2025
Bank failures (count) ↑
Year →
-
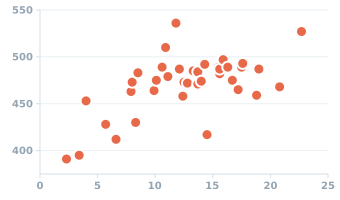 Math scores at 15 (PISA 2022) and yearly school spending per student
Math score (PISA points) ↑
Spending per student ($ thousands) →
-
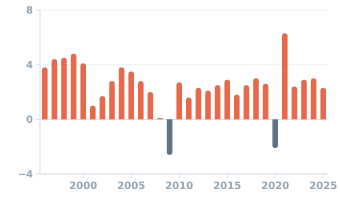 US real GDP growth by year, 1996–2025
Economic growth (% per year) ↑
Year →