US bank failures by year, 1986–2025
530 banks and thrifts failed in 1989, in the savings and loan crisis, and 157 in 2010, after the financial crisis. In 5 of these years, none did.
What does this axis measure?
Bank failures (count)
What does this axis measure?
Year
Reveal the axesHide the axes
- y ↑
- Bank failures (count)
- x →
- Year
Show the story, the data and the sourceHide the story, the data and the source
The data: 40 points
| Year | Bank failures (count) |
|---|---|
| 1986 | 162 |
| 1987 | 217 |
| 1988 | 232 |
| 1989 | 530 |
| 1990 | 381 |
| 1991 | 268 |
| 1992 | 179 |
| 1993 | 50 |
| 1994 | 15 |
| 1995 | 8 |
| 1996 | 6 |
| 1997 | 1 |
| 1998 | 3 |
| 1999 | 8 |
| 2000 | 7 |
| 2001 | 4 |
| 2002 | 11 |
| 2003 | 3 |
| 2004 | 4 |
| 2005 | 0 |
| 2006 | 0 |
| 2007 | 3 |
| 2008 | 25 |
| 2009 | 140 |
| 2010 | 157 |
| 2011 | 92 |
| 2012 | 51 |
| 2013 | 24 |
| 2014 | 18 |
| 2015 | 8 |
| 2016 | 5 |
| 2017 | 8 |
| 2018 | 0 |
| 2019 | 4 |
| 2020 | 4 |
| 2021 | 0 |
| 2022 | 0 |
| 2023 | 5 |
| 2024 | 2 |
| 2025 | 2 |
- Ran in puzzle #44 on November 9, 2026. Play it
More like this
-
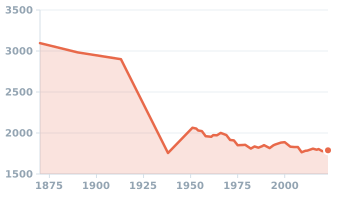 Hours worked per worker per year in the United States, 1870–2023
Working time (hours per year) ↑
Year →
-
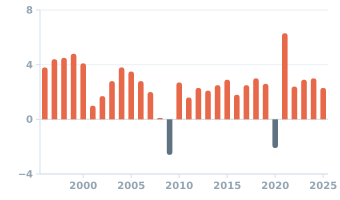 US real GDP growth by year, 1996–2025
Economic growth (% per year) ↑
Year →
-
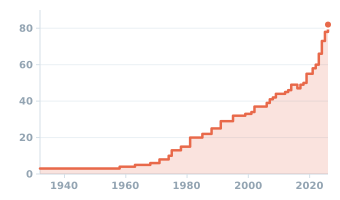 Price of a U.S. first-class stamp at the end of each year, 1932–2026
Stamp price (cents) ↑
Year →
-
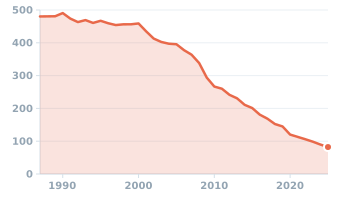 Jobs at US newspaper publishers, 1987–2025
Newspaper publishing jobs (thousands) ↑
Year →
-
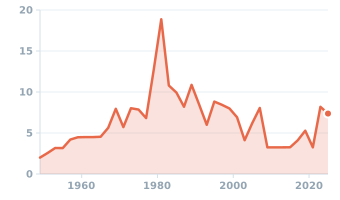 US bank prime loan rate, annual average, 1949–2025
Bank prime loan rate (%) ↑
Year →
-
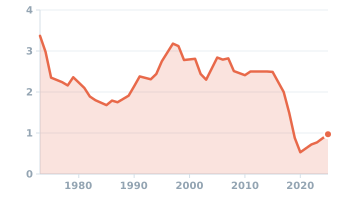 Venezuela's crude oil production, 1973–2025
Oil output (million barrels a day) ↑
Year →