Hours worked per worker per year in the United States, 1870–2023
Hours worked per US worker fell from 3,096 a year in 1870 to 1,789 in 2023, 42% fewer. Before 1950 the data cover only full-time nonfarm production workers, so the periods aren't directly comparable.
What does this axis measure?
Working time (hours per year)
What does this axis measure?
Year
Reveal the axesHide the axes
- y ↑
- Working time (hours per year)
- x →
- Year
Show the story, the data and the sourceHide the story, the data and the source
The data: 40 points
| Year | Working time (hours per year) |
|---|---|
| 1870 | 3096 |
| 1890 | 2983 |
| 1913 | 2900 |
| 1938 | 1756 |
| 1951 | 2064 |
| 1953 | 2054 |
| 1954 | 2031 |
| 1956 | 2023 |
| 1958 | 1961 |
| 1961 | 1954 |
| 1962 | 1974 |
| 1964 | 1972 |
| 1966 | 2001 |
| 1969 | 1975 |
| 1971 | 1915 |
| 1973 | 1910 |
| 1975 | 1851 |
| 1978 | 1854 |
| 1979 | 1856 |
| 1982 | 1810 |
| 1984 | 1836 |
| 1986 | 1821 |
| 1988 | 1839 |
| 1989 | 1852 |
| 1992 | 1816 |
| 1994 | 1850 |
| 1995 | 1860 |
| 1998 | 1883 |
| 2000 | 1888 |
| 2003 | 1833 |
| 2005 | 1829 |
| 2007 | 1829 |
| 2009 | 1765 |
| 2011 | 1783 |
| 2012 | 1785 |
| 2015 | 1809 |
| 2017 | 1796 |
| 2018 | 1804 |
| 2020 | 1778 |
| 2023 | 1789 |
- Ran in puzzle #43 on November 8, 2026. Play it
More like this
-
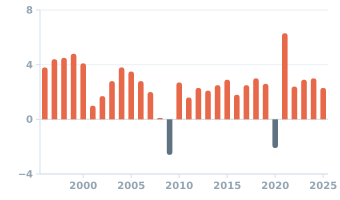 US real GDP growth by year, 1996–2025
Economic growth (% per year) ↑
Year →
-
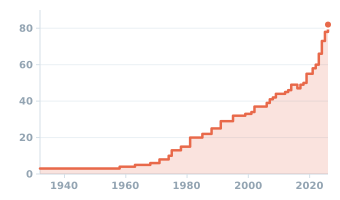 Price of a U.S. first-class stamp at the end of each year, 1932–2026
Stamp price (cents) ↑
Year →
-
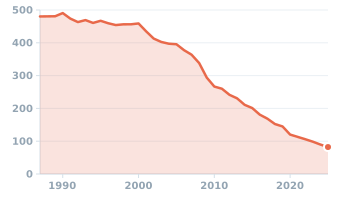 Jobs at US newspaper publishers, 1987–2025
Newspaper publishing jobs (thousands) ↑
Year →
-
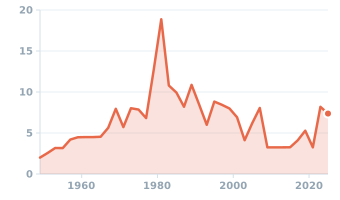 US bank prime loan rate, annual average, 1949–2025
Bank prime loan rate (%) ↑
Year →
-
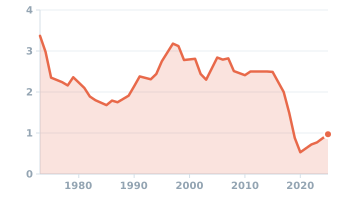 Venezuela's crude oil production, 1973–2025
Oil output (million barrels a day) ↑
Year →
-
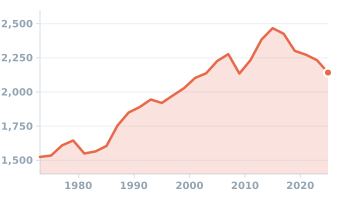 Median size of a new single-family house in the United States, 1973–2025
House size (square feet) ↑
Year →