Math scores at 15 (PISA 2022) and yearly school spending per student
Of these 38 countries, Japan had the top score, 536 points, though 23 of them spent more per student.
What does this axis measure?
Math score (PISA points)
What does this axis measure?
Spending per student ($ thousands)
Reveal the axesHide the axes
- y ↑
- Math score (PISA points)
- x →
- Spending per student ($ thousands)
Show the story, the data and the sourceHide the story, the data and the source
The data: 38 points
| Spending per student ($ thousands) | Math score (PISA points) |
|---|---|
| 2.3 | 391 |
| 3.4 | 395 |
| 4 | 453 |
| 5.7 | 428 |
| 6.6 | 412 |
| 7.9 | 463 |
| 8 | 473 |
| 8.3 | 430 |
| 8.5 | 483 |
| 9.9 | 464 |
| 10.1 | 475 |
| 10.6 | 489 |
| 10.9 | 510 |
| 11.1 | 479 |
| 11.8 | 536 |
| 12.1 | 487 |
| 12.4 | 458 |
| 12.5 | 473 |
| 12.8 | 472 |
| 13.3 | 485 |
| 13.7 | 471 |
| 13.7 | 484 |
| 14 | 474 |
| 14.3 | 492 |
| 14.5 | 417 |
| 15.5 | 489 |
| 15.6 | 482 |
| 15.6 | 487 |
| 15.9 | 497 |
| 16.3 | 489 |
| 16.7 | 475 |
| 17.2 | 465 |
| 17.5 | 489 |
| 17.6 | 493 |
| 18.8 | 459 |
| 19 | 487 |
| 20.8 | 468 |
| 22.7 | 527 |
- Ran in puzzle #40 on November 5, 2026. Play it
More like this
-
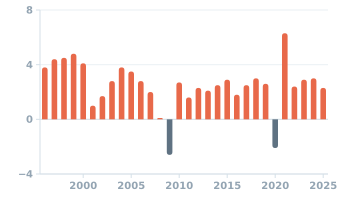 US real GDP growth by year, 1996–2025
Economic growth (% per year) ↑
Year →
-
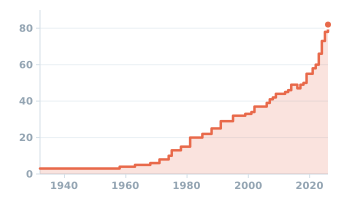 Price of a U.S. first-class stamp at the end of each year, 1932–2026
Stamp price (cents) ↑
Year →
-
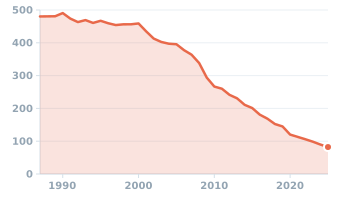 Jobs at US newspaper publishers, 1987–2025
Newspaper publishing jobs (thousands) ↑
Year →
-
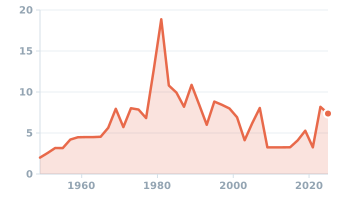 US bank prime loan rate, annual average, 1949–2025
Bank prime loan rate (%) ↑
Year →
-
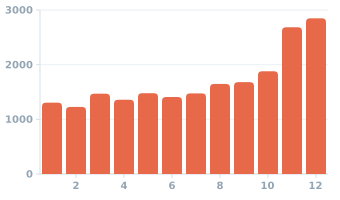 Monthly U.S. sales at hobby, toy and game stores, 2025
Store sales ($ millions) ↑
Month →
-
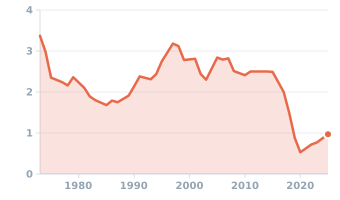 Venezuela's crude oil production, 1973–2025
Oil output (million barrels a day) ↑
Year →