US Treasury yield curve on 31 August 2026
On this day lending to the US government for 30 years paid 5.25% a year, against 3.85% for one month.
What does this axis measure?
Yield (%)
What does this axis measure?
Maturity (years)
Reveal the axesHide the axes
- y ↑
- Yield (%)
- x →
- Maturity (years)
Show the story, the data and the sourceHide the story, the data and the source
The data: 11 points
| Maturity (years) | Yield (%) |
|---|---|
| 0.083 | 3.85 |
| 0.25 | 3.91 |
| 0.5 | 3.99 |
| 1 | 4.16 |
| 2 | 4.34 |
| 3 | 4.4 |
| 5 | 4.49 |
| 7 | 4.62 |
| 10 | 4.75 |
| 20 | 5.24 |
| 30 | 5.25 |
- Ran in puzzle #3 on September 29, 2026. Play it
More like this
-
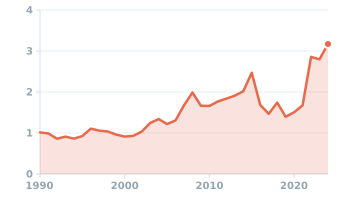 US price of a dozen eggs, annual average, 1990–2024
Price ($/dozen) ↑
Year →
US price of a dozen eggs, annual average, 1990–2024
Price ($/dozen) ↑
Year →
-
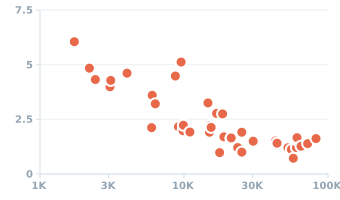 GDP per capita and births per woman in the 40 most populous countries, 2023
Fertility (births per woman) ↑
GDP per capita, PPP (intl $) →
GDP per capita and births per woman in the 40 most populous countries, 2023
Fertility (births per woman) ↑
GDP per capita, PPP (intl $) →
-
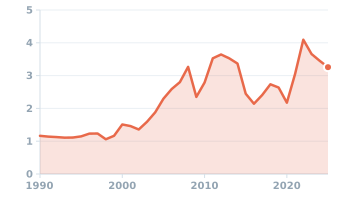 US price of regular gasoline, annual average, 1990–2025
Price ($/gallon) ↑
Year →
US price of regular gasoline, annual average, 1990–2025
Price ($/gallon) ↑
Year →
-
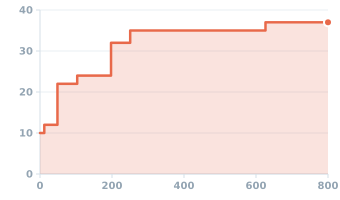 US federal income tax brackets, single filer, tax year 2025
Marginal tax rate (%) ↑
Taxable income ($ thousands) →
US federal income tax brackets, single filer, tax year 2025
Marginal tax rate (%) ↑
Taxable income ($ thousands) →