Trade and population of 40 countries and territories, 2023
Trade adds exports and imports, so it can pass 100% of GDP: in 2023 it was 324% in Singapore, and 46% in India, the most populous country here.
What does this axis measure?
Trade (% of GDP)
What does this axis measure?
Population (millions)
Reveal the axesHide the axes
- y ↑
- Trade (% of GDP)
- x →
- Population (millions)
Show the story, the data and the sourceHide the story, the data and the source
The data: 40 points
| Population (millions) | Trade (% of GDP) |
|---|---|
| 0.1 | 79.6 |
| 0.13 | 106.5 |
| 0.32 | 78.1 |
| 0.46 | 136.9 |
| 0.62 | 116.8 |
| 0.85 | 44.4 |
| 1.25 | 147.3 |
| 1.58 | 157.4 |
| 1.88 | 135.6 |
| 2.46 | 94 |
| 2.87 | 148 |
| 3.2 | 101.7 |
| 4.46 | 88.3 |
| 5.11 | 71.4 |
| 5.31 | 239.6 |
| 5.92 | 323.7 |
| 6.45 | 119.9 |
| 7.1 | 132.4 |
| 8.46 | 55.3 |
| 9.59 | 158.6 |
| 10.41 | 92.5 |
| 10.64 | 98.8 |
| 11.78 | 166 |
| 14.11 | 44.7 |
| 17.88 | 165 |
| 19.06 | 83.4 |
| 20.72 | 78.2 |
| 23.77 | 57.6 |
| 29.69 | 41.6 |
| 33.7 | 55.8 |
| 35.65 | 63.1 |
| 40.05 | 66.6 |
| 46.16 | 43.7 |
| 51.71 | 82.3 |
| 63.21 | 65.7 |
| 83.29 | 82 |
| 105.79 | 86.7 |
| 128.69 | 20.6 |
| 247.5 | 28.5 |
| 1438.07 | 46.3 |
- Ran in puzzle #11 on October 7, 2026. Play it
More like this
-
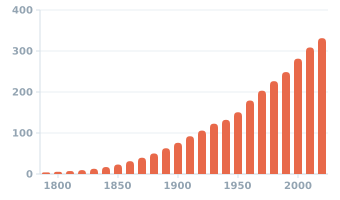 US population at each census, 1790–2020
Population (millions) ↑
Year →
US population at each census, 1790–2020
Population (millions) ↑
Year →
-
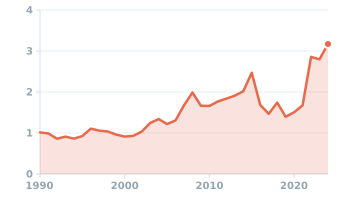 US price of a dozen eggs, annual average, 1990–2024
Price ($/dozen) ↑
Year →
US price of a dozen eggs, annual average, 1990–2024
Price ($/dozen) ↑
Year →
-
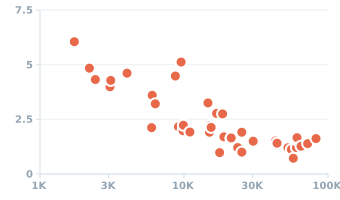 GDP per capita and births per woman in the 40 most populous countries, 2023
Fertility (births per woman) ↑
GDP per capita, PPP (intl $) →
GDP per capita and births per woman in the 40 most populous countries, 2023
Fertility (births per woman) ↑
GDP per capita, PPP (intl $) →
-
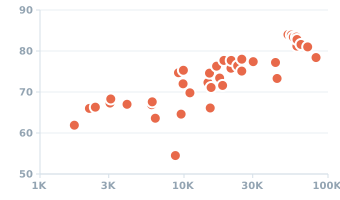 Income and life expectancy in the 40 most populous countries, 2023
Life expectancy (years) ↑
GDP per capita ($) →
Income and life expectancy in the 40 most populous countries, 2023
Life expectancy (years) ↑
GDP per capita ($) →
-
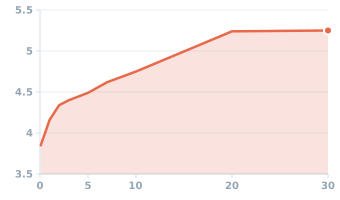 US Treasury yield curve on 31 August 2026
Yield (%) ↑
Maturity (years) →
US Treasury yield curve on 31 August 2026
Yield (%) ↑
Maturity (years) →
-
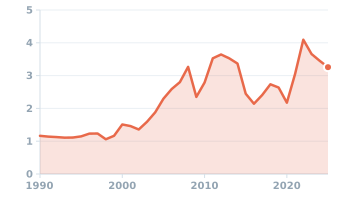 US price of regular gasoline, annual average, 1990–2025
Price ($/gallon) ↑
Year →
US price of regular gasoline, annual average, 1990–2025
Price ($/gallon) ↑
Year →