Does GDP predict life expectancy?
Among these countries life expectancy runs from 54 years in Nigeria to 84 in Japan; incomes differ by a factor of 48.
What does this axis measure?
Life expectancy (years)
What does this axis measure?
GDP per capita ($)
Reveal the axesHide the axes
- y ↑
- Life expectancy (years)
- x →
- GDP per capita ($)
Show the story, the data and the sourceHide the story, the data and the source
What's going on here
Each dot is one of the 40 most populous countries in 2023.
The countries
Each dot shows a country by income. Income is GDP per person, adjusted for differences in purchasing power, and life expectancy is measured at birth. This data is from 2023.
| Country | GDP per capita ($) | Life expectancy (years) |
|---|---|---|
| Democratic Republic of the Congo | 1,732 | 61.9 |
| Afghanistan | 2,204 | 66.0 |
| Sudan | 2,423 | 66.3 |
| Ethiopia | 3,063 | 67.3 |
| Uganda | 3,100 | 68.3 |
| Tanzania | 4,022 | 67.0 |
| Myanmar | 5,958 | 66.9 |
| Pakistan | 6,019 | 67.6 |
| Kenya | 6,322 | 63.6 |
| Nigeria | 8,712 | 54.5 |
| Bangladesh | 9,155 | 74.7 |
| Angola | 9,550 | 64.6 |
| India | 9,853 | 72.0 |
| Morocco | 9,903 | 75.3 |
| Philippines | 10,995 | 69.8 |
| Iraq | 14,665 | 72.3 |
| Vietnam | 15,034 | 74.6 |
| South Africa | 15,212 | 66.1 |
| Indonesia | 15,428 | 71.1 |
| Algeria | 16,838 | 76.3 |
| Ukraine | 17,680 | 73.4 |
| Egypt | 18,540 | 71.6 |
| Iran | 18,933 | 77.7 |
| Brazil | 21,193 | 75.8 |
| Colombia | 21,282 | 77.7 |
| Thailand | 23,598 | 76.4 |
| Mexico | 25,188 | 75.1 |
| China | 25,200 | 78.0 |
| Argentina | 30,246 | 77.4 |
| Türkiye | 43,196 | 77.2 |
| Russia | 44,299 | 73.3 |
| Japan | 52,726 | 84.0 |
| Spain | 55,661 | 83.9 |
| South Korea | 57,430 | 83.4 |
| Italy | 60,350 | 83.4 |
| United Kingdom | 60,787 | 81.2 |
| France | 60,927 | 82.8 |
| Canada | 64,962 | 81.6 |
| Germany | 72,262 | 81.0 |
| United States | 82,587 | 78.4 |
Where the data comes from
World Bank, World Development Indicators (NY.GDP.PCAP.PP.CD, SP.DYN.LE00.IN, SP.POP.TOTL), at data.worldbank.org. Licence: CC-BY 4.0.
The data: 40 points
| GDP per capita ($) | Life expectancy (years) |
|---|---|
| 1,732 | 61.9 |
| 2,204 | 66 |
| 2,423 | 66.3 |
| 3,063 | 67.3 |
| 3,100 | 68.3 |
| 4,022 | 67 |
| 5,958 | 66.9 |
| 6,019 | 67.6 |
| 6,322 | 63.6 |
| 8,712 | 54.5 |
| 9,155 | 74.7 |
| 9,550 | 64.6 |
| 9,853 | 72 |
| 9,903 | 75.3 |
| 10,995 | 69.8 |
| 14,665 | 72.3 |
| 15,034 | 74.6 |
| 15,212 | 66.1 |
| 15,428 | 71.1 |
| 16,838 | 76.3 |
| 17,680 | 73.4 |
| 18,540 | 71.6 |
| 18,933 | 77.7 |
| 21,193 | 75.8 |
| 21,282 | 77.7 |
| 23,598 | 76.4 |
| 25,188 | 75.1 |
| 25,200 | 78 |
| 30,246 | 77.4 |
| 43,196 | 77.2 |
| 44,299 | 73.3 |
| 52,726 | 84 |
| 55,661 | 83.9 |
| 57,430 | 83.4 |
| 60,350 | 83.4 |
| 60,787 | 81.2 |
| 60,927 | 82.8 |
| 64,962 | 81.6 |
| 72,262 | 81 |
| 82,587 | 78.4 |
- Ran in puzzle #3 on September 29, 2026. Play it
More like this
-
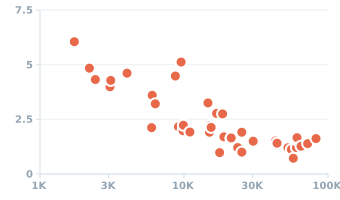 GDP per capita and births per woman in the 40 most populous countries, 2023
Fertility (births per woman) ↑
GDP per capita, PPP (intl $) →
GDP per capita and births per woman in the 40 most populous countries, 2023
Fertility (births per woman) ↑
GDP per capita, PPP (intl $) →
-
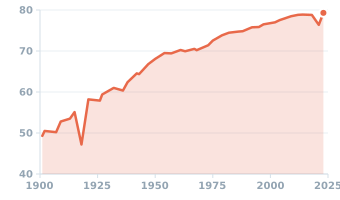 US life expectancy at birth, 1901–2023
Age (years) ↑
Year →
US life expectancy at birth, 1901–2023
Age (years) ↑
Year →
-
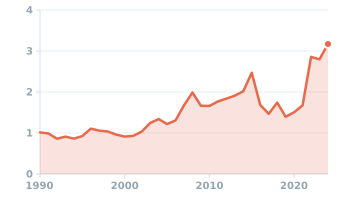 US price of a dozen eggs, annual average, 1990–2024
Price ($/dozen) ↑
Year →
US price of a dozen eggs, annual average, 1990–2024
Price ($/dozen) ↑
Year →
-
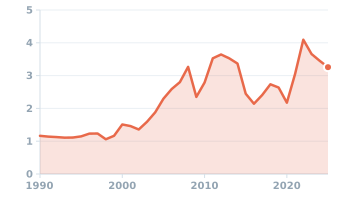 US price of regular gasoline, annual average, 1990–2025
Price ($/gallon) ↑
Year →
US price of regular gasoline, annual average, 1990–2025
Price ($/gallon) ↑
Year →
-
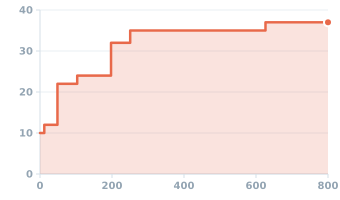 US federal income tax brackets, single filer, tax year 2025
Marginal tax rate (%) ↑
Taxable income ($ thousands) →
US federal income tax brackets, single filer, tax year 2025
Marginal tax rate (%) ↑
Taxable income ($ thousands) →