US life expectancy at birth, 1901–2023
The biggest one-year fall was in 1918, the year of the flu pandemic: 6.8 years, from 54.0 to 47.2.
What does this axis measure?
Age (years)
What does this axis measure?
Year
Reveal the axesHide the axes
- y ↑
- Age (years)
- x →
- Year
Show the story, the data and the sourceHide the story, the data and the source
The data: 40 points
| Year | Age (years) |
|---|---|
| 1901 | 49.3 |
| 1902 | 50.5 |
| 1907 | 50.2 |
| 1909 | 52.8 |
| 1913 | 53.5 |
| 1915 | 55.1 |
| 1918 | 47.2 |
| 1921 | 58.2 |
| 1926 | 57.9 |
| 1927 | 59.4 |
| 1932 | 61 |
| 1936 | 60.35 |
| 1938 | 62.39 |
| 1942 | 64.54 |
| 1943 | 64.36 |
| 1947 | 66.8 |
| 1950 | 68.07 |
| 1954 | 69.5 |
| 1957 | 69.42 |
| 1961 | 70.25 |
| 1963 | 69.94 |
| 1967 | 70.52 |
| 1968 | 70.2 |
| 1973 | 71.4 |
| 1975 | 72.54 |
| 1979 | 73.83 |
| 1982 | 74.46 |
| 1986 | 74.73 |
| 1988 | 74.83 |
| 1992 | 75.78 |
| 1995 | 75.85 |
| 1997 | 76.5 |
| 2002 | 76.99 |
| 2004 | 77.53 |
| 2009 | 78.48 |
| 2012 | 78.82 |
| 2014 | 78.88 |
| 2018 | 78.8 |
| 2021 | 76.38 |
| 2023 | 79.3 |
- Ran in puzzle #1 on September 27, 2026. Play it
More like this
-
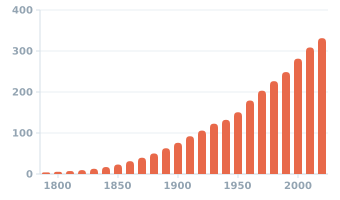 US population at each census, 1790–2020
Population (millions) ↑
Year →
US population at each census, 1790–2020
Population (millions) ↑
Year →
-
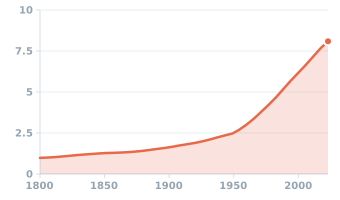 World population, 1800–2023
Population (billions) ↑
Year →
World population, 1800–2023
Population (billions) ↑
Year →
-
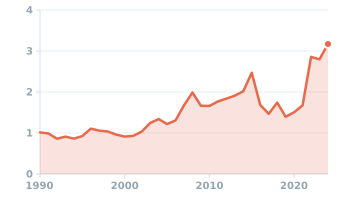 US price of a dozen eggs, annual average, 1990–2024
Price ($/dozen) ↑
Year →
US price of a dozen eggs, annual average, 1990–2024
Price ($/dozen) ↑
Year →
-
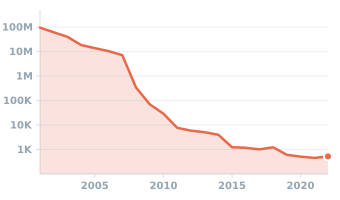 Cost of sequencing a human genome, 2001–2022
Cost per genome ($) ↑
Year →
Cost of sequencing a human genome, 2001–2022
Cost per genome ($) ↑
Year →
-
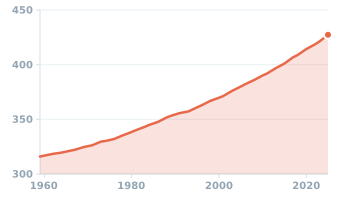 Atmospheric CO₂ at Mauna Loa, 1959–2025
CO₂ concentration (ppm) ↑
Year →
Atmospheric CO₂ at Mauna Loa, 1959–2025
CO₂ concentration (ppm) ↑
Year →
-
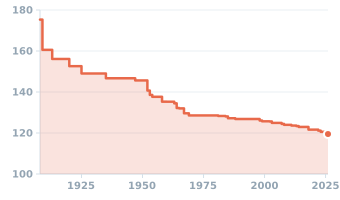 Men's marathon world record, 1908–2026
World record (minutes) ↑
Year →
Men's marathon world record, 1908–2026
World record (minutes) ↑
Year →