Colorado weather stations: elevation and normal yearly snowfall, 1991–2020
Climax, 11,344 feet up, gets 295 inches of snow in a normal year. Alamosa, at 7,533 feet, gets 28 inches, less than Boulder at 5,484 feet.
What does this axis measure?
Yearly snowfall (inches)
What does this axis measure?
Elevation (feet)
Reveal the axesHide the axes
- y ↑
- Yearly snowfall (inches)
- x →
- Elevation (feet)
Show the story, the data and the sourceHide the story, the data and the source
The data: 40 points
| Elevation (feet) | Yearly snowfall (inches) |
|---|---|
| 3,401 | 21.5 |
| 3,717 | 24.1 |
| 3,890 | 16.2 |
| 4,065 | 20.3 |
| 4,134 | 22.8 |
| 4,210 | 25.8 |
| 4,302 | 15.9 |
| 4,376 | 22.7 |
| 4,671 | 11.2 |
| 4,760 | 12.6 |
| 4,851 | 26.9 |
| 4,920 | 48.4 |
| 5,016 | 34.5 |
| 5,101 | 42.7 |
| 5,230 | 40 |
| 5,398 | 75.5 |
| 5,484 | 92.8 |
| 5,610 | 34.1 |
| 5,789 | 21.5 |
| 5,960 | 26.1 |
| 6,140 | 51.2 |
| 6,292 | 91.6 |
| 6,467 | 113 |
| 6,866 | 184.5 |
| 6,950 | 69.7 |
| 7,080 | 121.1 |
| 7,180 | 129.7 |
| 7,533 | 27.9 |
| 7,603 | 32.2 |
| 7,695 | 29.7 |
| 7,744 | 51.2 |
| 7,845 | 38.6 |
| 7,970 | 99.1 |
| 8,175 | 170.8 |
| 8,460 | 105.3 |
| 8,644 | 104.8 |
| 8,867 | 203 |
| 9,060 | 133.5 |
| 9,492 | 107.7 |
| 11,344 | 294.7 |
- Ran in puzzle #38 on November 3, 2026. Play it
More like this
-
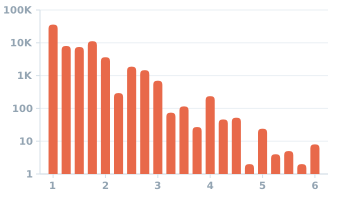 US reports of severe hail by the size of the hailstones, 2016–2025
Hail reports (count) ↑
Hailstone size (inches) →
-
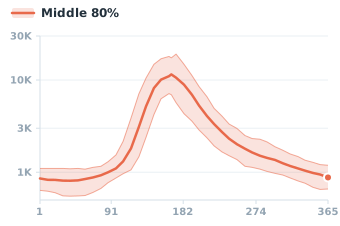 Yellowstone River at Corwin Springs, Montana: median flow by day of the year
River flow (cubic feet per second) ↑
Day of year →
-
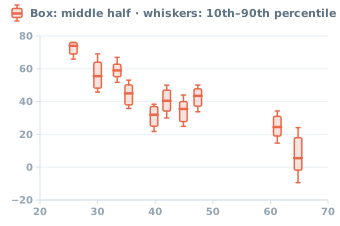 Halloween low temperatures by latitude in 10 U.S. cities, 1996–2025
Day's low (°F) ↑
Latitude (°N) →
-
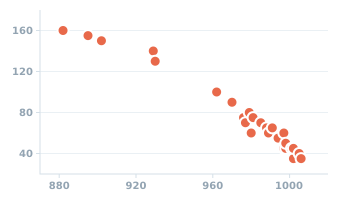 Atlantic tropical and subtropical storms of 2005: peak wind and lowest pressure
Peak wind (knots) ↑
Lowest pressure (millibars) →
-
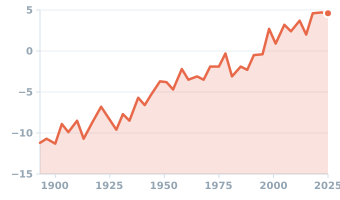 Sea level at The Battery, the southern tip of Manhattan, 1893–2025
Sea level (inches vs 1983–2001 average) ↑
Year →
-
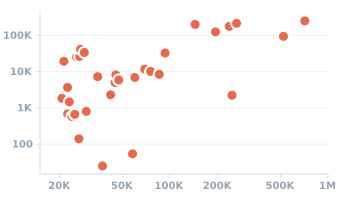 Big U.S. rivers at selected gauges: drainage area vs average flow, 1995–2024
Average flow (cubic feet per second) ↑
Drainage area (square miles) →