Yellowstone River at Corwin Springs, Montana: median flow by day of the year
Its median flow peaks on June 16 at 11,500 cubic feet per second, 14 times its lowest median, on January 29.
What does this axis measure?
River flow (cubic feet per second)
What does this axis measure?
Day of year
Reveal the axesHide the axes
- y ↑
- River flow (cubic feet per second)
- x →
- Day of year
- Band
- Middle 80%
Show the story, the data and the sourceHide the story, the data and the source
The data: 40 points
| Day of year | River flow (cubic feet per second) | Middle 80%, low edge | Middle 80%, high edge |
|---|---|---|---|
| 1 | 856 | 636 | 1,100 |
| 11 | 827 | 622 | 1,100 |
| 20 | 826 | 600 | 1,100 |
| 30 | 811 | 554 | 1,100 |
| 39 | 809 | 550 | 1,090 |
| 49 | 816 | 553 | 1,100 |
| 58 | 844 | 559 | 1,080 |
| 68 | 878 | 604 | 1,130 |
| 78 | 927 | 667 | 1,160 |
| 87 | 999 | 770 | 1,300 |
| 97 | 1,100 | 866 | 1,540 |
| 106 | 1,310 | 963 | 2,160 |
| 116 | 1,810 | 1,060 | 3,860 |
| 126 | 3,110 | 1,470 | 7,090 |
| 135 | 5,180 | 2,390 | 10,500 |
| 145 | 8,180 | 4,220 | 14,800 |
| 154 | 10,100 | 6,260 | 17,000 |
| 164 | 11,000 | 7,120 | 18,000 |
| 167 | 11,500 | 6,920 | 17,400 |
| 173 | 10,600 | 5,670 | 19,100 |
| 183 | 8,900 | 4,310 | 14,800 |
| 193 | 6,930 | 3,580 | 11,200 |
| 202 | 5,280 | 2,870 | 8,490 |
| 212 | 4,070 | 2,360 | 6,590 |
| 221 | 3,330 | 1,930 | 4,930 |
| 231 | 2,730 | 1,660 | 4,060 |
| 240 | 2,310 | 1,510 | 3,330 |
| 250 | 2,010 | 1,370 | 2,980 |
| 260 | 1,800 | 1,160 | 2,500 |
| 269 | 1,640 | 1,130 | 2,320 |
| 279 | 1,510 | 1,080 | 2,280 |
| 288 | 1,430 | 1,020 | 2,130 |
| 298 | 1,360 | 972 | 1,890 |
| 308 | 1,250 | 932 | 1,730 |
| 317 | 1,170 | 868 | 1,580 |
| 327 | 1,100 | 805 | 1,480 |
| 336 | 1,040 | 760 | 1,350 |
| 346 | 982 | 686 | 1,280 |
| 355 | 945 | 651 | 1,210 |
| 365 | 878 | 658 | 1,190 |
- Ran in puzzle #36 on November 1, 2026. Play it
More like this
-
 Chance of an inch or more of snow on the ground, Minneapolis, 1991–2020
Chance of snow on the ground (%) ↑
Day of year →
-
 Atlantic named storms by time of year, 1966–2025
Named storms (count) ↑
Day of year →
-
 Horror films by the time of year they first came out, 2000–2024
Horror films (count) ↑
Day of year →
-
 Sunrise in Anchorage, Alaska, through 2026
Sunrise (hour, local) ↑
Day of year →
-
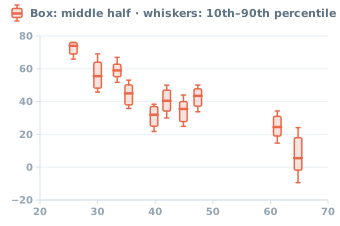 Halloween low temperatures by latitude in 10 U.S. cities, 1996–2025
Day's low (°F) ↑
Latitude (°N) →
-
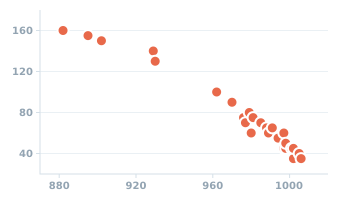 Atlantic tropical and subtropical storms of 2005: peak wind and lowest pressure
Peak wind (knots) ↑
Lowest pressure (millibars) →