Big U.S. rivers at selected gauges: drainage area vs average flow, 1995–2024
At their gauges the Missouri drains 522,500 square miles, the Ohio 144,000. Yet the Ohio carries 199,980 cubic feet of water a second, the Missouri 93,619.
What does this axis measure?
Average flow (cubic feet per second)
What does this axis measure?
Drainage area (square miles)
Reveal the axesHide the axes
- y ↑
- Average flow (cubic feet per second)
- x →
- Drainage area (square miles)
Show the story, the data and the sourceHide the story, the data and the source
The data: 34 points
| Drainage area (square miles) | Average flow (cubic feet per second) |
|---|---|
| 20,672 | 1,827 |
| 21,251 | 19,287 |
| 22,417 | 3,674 |
| 22,452 | 684 |
| 23,000 | 1,465 |
| 23,900 | 576 |
| 24,900 | 660 |
| 24,900 | 25,514 |
| 25,560 | 25,357 |
| 26,459 | 140 |
| 26,743 | 26,215 |
| 27,100 | 41,184 |
| 28,635 | 33,655 |
| 29,450 | 801 |
| 34,800 | 7,250 |
| 37,300 | 25 |
| 42,003 | 2,293 |
| 44,445 | 8,555 |
| 44,850 | 4,988 |
| 45,339 | 8,123 |
| 47,283 | 5,880 |
| 57,850 | 54 |
| 59,756 | 6,888 |
| 69,099 | 11,672 |
| 75,293 | 10,067 |
| 85,370 | 8,429 |
| 92,960 | 32,586 |
| 144,000 | 199,980 |
| 194,000 | 124,732 |
| 237,000 | 177,040 |
| 246,700 | 2,233 |
| 263,700 | 214,730 |
| 522,500 | 93,619 |
| 713,200 | 250,610 |
- Ran in puzzle #22 on October 18, 2026. Play it
More like this
-
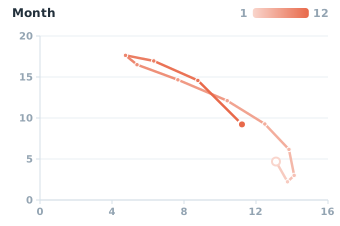 Sea ice at both ends of the Earth, month by month, 2025
Antarctic sea ice (million km²) ↑
Arctic sea ice (million km²) →
-
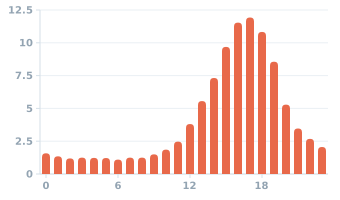 US tornadoes by time of day, 1995–2024
Share of tornadoes (%) ↑
Time of day (hour) →
-
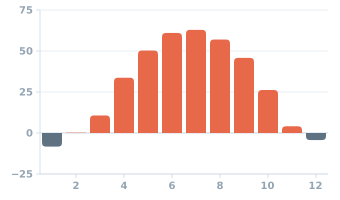 Fairbanks, Alaska: average temperature by month
Temperature (°F) ↑
Month →
-
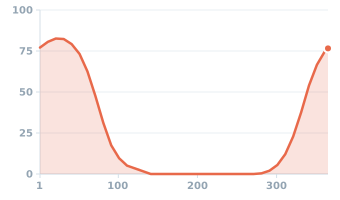 Chance of an inch or more of snow on the ground, Minneapolis, 1991–2020
Chance of snow on the ground (%) ↑
Day of year →
-
 Growing season between frosts and yearly mean temperature, 38 large US cities
Growing season (days) ↑
Yearly mean temperature (°F) →
-
 Atlantic named storms by time of year, 1966–2025
Named storms (count) ↑
Day of year →