Atlantic tropical and subtropical storms of 2005: peak wind and lowest pressure
Wilma fell to 882 millibars, the lowest pressure in the Atlantic record, with winds of 160 knots. Katrina reached 902 millibars and 150 knots.
What does this axis measure?
Peak wind (knots)
What does this axis measure?
Lowest pressure (millibars)
Reveal the axesHide the axes
- y ↑
- Peak wind (knots)
- x →
- Lowest pressure (millibars)
Show the story, the data and the sourceHide the story, the data and the source
The data: 28 points
| Lowest pressure (millibars) | Peak wind (knots) |
|---|---|
| 882 | 160 |
| 895 | 155 |
| 902 | 150 |
| 929 | 140 |
| 930 | 130 |
| 962 | 100 |
| 962 | 100 |
| 970 | 90 |
| 976 | 75 |
| 977 | 70 |
| 979 | 80 |
| 980 | 60 |
| 981 | 75 |
| 985 | 70 |
| 988 | 65 |
| 989 | 60 |
| 991 | 65 |
| 994 | 55 |
| 994 | 55 |
| 997 | 45 |
| 997 | 60 |
| 998 | 45 |
| 998 | 50 |
| 1001 | 45 |
| 1002 | 35 |
| 1002 | 45 |
| 1005 | 40 |
| 1006 | 35 |
- Ran in puzzle #33 on October 29, 2026. Play it
More like this
-
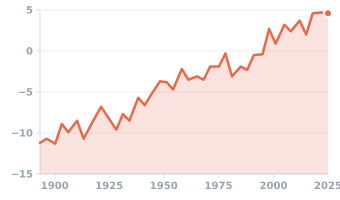 Sea level at The Battery, the southern tip of Manhattan, 1893–2025
Sea level (inches vs 1983–2001 average) ↑
Year →
-
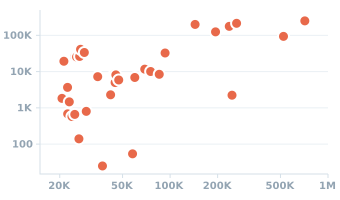 Big U.S. rivers at selected gauges: drainage area vs average flow, 1995–2024
Average flow (cubic feet per second) ↑
Drainage area (square miles) →
-
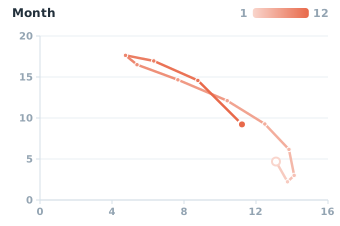 Sea ice at both ends of the Earth, month by month, 2025
Antarctic sea ice (million km²) ↑
Arctic sea ice (million km²) →
-
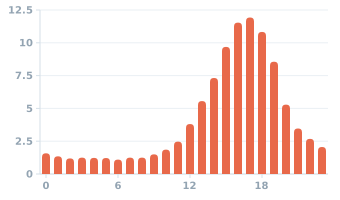 US tornadoes by time of day, 1995–2024
Share of tornadoes (%) ↑
Time of day (hour) →
-
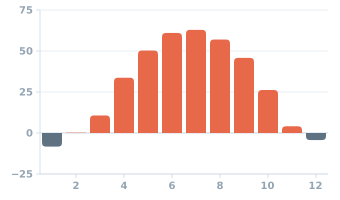 Fairbanks, Alaska: average temperature by month
Temperature (°F) ↑
Month →
-
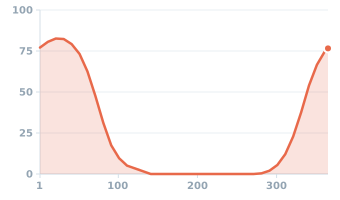 Chance of an inch or more of snow on the ground, Minneapolis, 1991–2020
Chance of snow on the ground (%) ↑
Day of year →