World population, 1800–2023
It took until 1927 to reach 2 billion, then the world added the next 6 billion by 2022.
What does this axis measure?
Population (billions)
What does this axis measure?
Year
Reveal the axesHide the axes
- y ↑
- Population (billions)
- x →
- Year
Show the story, the data and the sourceHide the story, the data and the source
The data: 40 points
| Year | Population (billions) |
|---|---|
| 1800 | 0.983 |
| 1806 | 1.004 |
| 1811 | 1.026 |
| 1817 | 1.067 |
| 1823 | 1.111 |
| 1829 | 1.156 |
| 1834 | 1.186 |
| 1840 | 1.22 |
| 1846 | 1.254 |
| 1851 | 1.279 |
| 1857 | 1.29 |
| 1863 | 1.309 |
| 1869 | 1.335 |
| 1874 | 1.368 |
| 1880 | 1.415 |
| 1886 | 1.477 |
| 1891 | 1.531 |
| 1897 | 1.593 |
| 1903 | 1.667 |
| 1909 | 1.754 |
| 1914 | 1.817 |
| 1920 | 1.895 |
| 1926 | 1.997 |
| 1932 | 2.113 |
| 1937 | 2.225 |
| 1943 | 2.349 |
| 1949 | 2.468 |
| 1954 | 2.686 |
| 1960 | 3.015 |
| 1966 | 3.404 |
| 1972 | 3.845 |
| 1977 | 4.218 |
| 1983 | 4.697 |
| 1989 | 5.234 |
| 1994 | 5.676 |
| 2000 | 6.172 |
| 2006 | 6.671 |
| 2012 | 7.201 |
| 2017 | 7.646 |
| 2023 | 8.092 |
- Ran in puzzle #3 on September 29, 2026. Play it
More like this
-
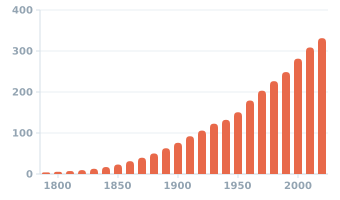 US population at each census, 1790–2020
Population (millions) ↑
Year →
US population at each census, 1790–2020
Population (millions) ↑
Year →
-
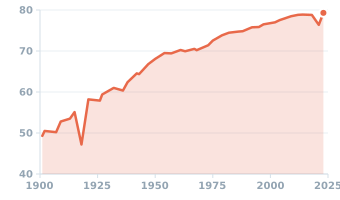 US life expectancy at birth, 1901–2023
Age (years) ↑
Year →
US life expectancy at birth, 1901–2023
Age (years) ↑
Year →
-
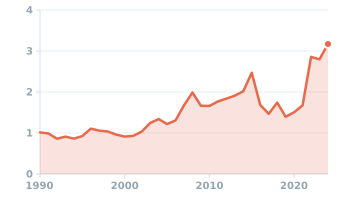 US price of a dozen eggs, annual average, 1990–2024
Price ($/dozen) ↑
Year →
US price of a dozen eggs, annual average, 1990–2024
Price ($/dozen) ↑
Year →
-
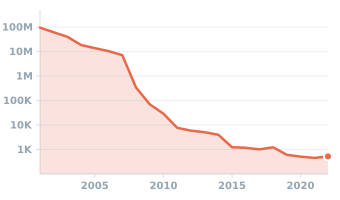 Cost of sequencing a human genome, 2001–2022
Cost per genome ($) ↑
Year →
Cost of sequencing a human genome, 2001–2022
Cost per genome ($) ↑
Year →
-
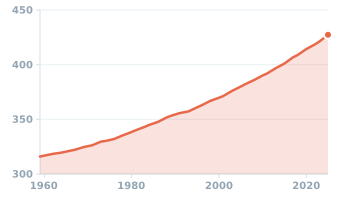 Atmospheric CO₂ at Mauna Loa, 1959–2025
CO₂ concentration (ppm) ↑
Year →
Atmospheric CO₂ at Mauna Loa, 1959–2025
CO₂ concentration (ppm) ↑
Year →
-
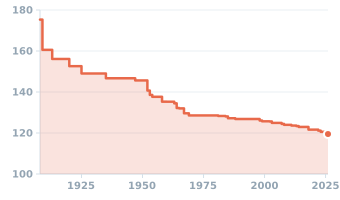 Men's marathon world record, 1908–2026
World record (minutes) ↑
Year →
Men's marathon world record, 1908–2026
World record (minutes) ↑
Year →