Detroit: population change from one census to the next, 1830–2020
Detroit added 575 thousand people in the 1920s and peaked at 1.85 million in 1950. Every census since has counted fewer: 639 thousand in 2020.
What does this axis measure?
Population change (thousands)
What does this axis measure?
Year
Reveal the axesHide the axes
- y ↑
- Population change (thousands)
- x →
- Year
Show the story, the data and the sourceHide the story, the data and the source
The data: 20 points
| Year | Population change (thousands) |
|---|---|
| 1830 | 0.8 |
| 1840 | 6.9 |
| 1850 | 11.9 |
| 1860 | 24.6 |
| 1870 | 34 |
| 1880 | 36.8 |
| 1890 | 89.5 |
| 1900 | 79.8 |
| 1910 | 180.1 |
| 1920 | 527.9 |
| 1930 | 575 |
| 1940 | 54.8 |
| 1950 | 226.1 |
| 1960 | −179.4 |
| 1970 | −158.7 |
| 1980 | −308.1 |
| 1990 | −175.4 |
| 2000 | −76.7 |
| 2010 | −237.5 |
| 2020 | −74.7 |
- Ran in puzzle #26 on October 22, 2026. Play it
More like this
-
 US population at each census, 1790–2020
Population (millions) ↑
Year →
-
 World population, 1800–2023
Population (billions) ↑
Year →
-
 US life expectancy at birth, 1901–2023
Age (years) ↑
Year →
-
 Colors in each year's LEGO sets, 1986–2025
Brick colors in use (count) ↑
Year →
-
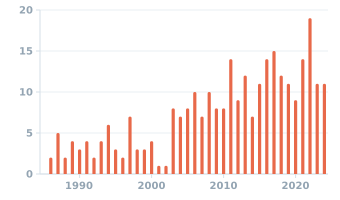 Superhero films released each year, 1985–2024
Superhero films (count) ↑
Year →
-
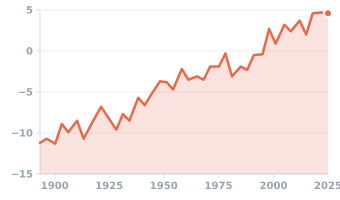 Sea level at The Battery, the southern tip of Manhattan, 1893–2025
Sea level (inches vs 1983–2001 average) ↑
Year →