When do tornadoes happen in the United States?
The United States averaged 1,254 tornadoes a year over these 30 years; May alone brought 281 of them, February only 38.
What does this axis measure?
Tornadoes per month (count)
What does this axis measure?
Month
Reveal the axesHide the axes
- y ↑
- Tornadoes per month (count)
- x →
- Month
Show the story, the data and the sourceHide the story, the data and the source
What's going on here
Each bar is one month, averaged over the years 1995 to 2024. The United States averaged 1,254 tornadoes a year over these 30 years, and the chart is a visual way to see which parts of the year they are most concentrated.
Where the data comes from
NOAA/NWS Storm Prediction Center, Severe Weather Database, at spc.noaa.gov. The monthly averages are calculated by Unlabeled. Licence: public domain (U.S. government work).
The data: 12 points
| Month | Tornadoes per month (count) |
|---|---|
| 1 | 44.5 |
| 2 | 37.6 |
| 3 | 90.7 |
| 4 | 190.5 |
| 5 | 280.8 |
| 6 | 194.7 |
| 7 | 113.5 |
| 8 | 81.9 |
| 9 | 63.8 |
| 10 | 62.3 |
| 11 | 51.6 |
| 12 | 42 |
- Ran in puzzle #7 on October 3, 2026. Play it
More like this
-
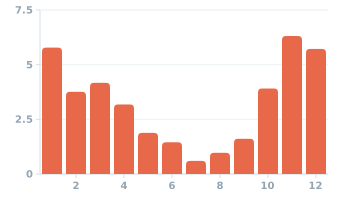 Seattle: average precipitation by month
Precipitation (inches) ↑
Month →
Seattle: average precipitation by month
Precipitation (inches) ↑
Month →
-
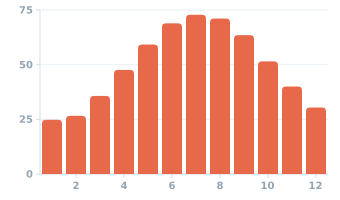 Grand Rapids, Michigan: average temperature by month
Temperature (°F) ↑
Month →
Grand Rapids, Michigan: average temperature by month
Temperature (°F) ↑
Month →
-
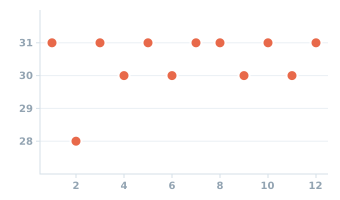 Days in each month of 2026
Days (count) ↑
Month →
Days in each month of 2026
Days (count) ↑
Month →
-
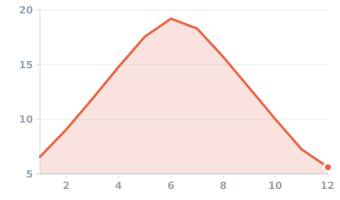 Daylight in Anchorage by month
Daylight (hours) ↑
Month →
Daylight in Anchorage by month
Daylight (hours) ↑
Month →
-
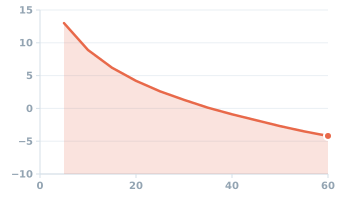 Wind chill at an air temperature of 20 °F
Wind chill (°F) ↑
Wind speed (mph) →
Wind chill at an air temperature of 20 °F
Wind chill (°F) ↑
Wind speed (mph) →
-
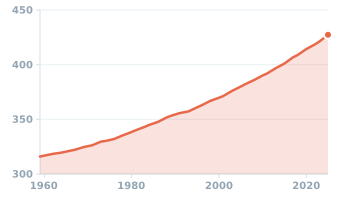 Atmospheric CO₂ at Mauna Loa, 1959–2025
CO₂ concentration (ppm) ↑
Year →
Atmospheric CO₂ at Mauna Loa, 1959–2025
CO₂ concentration (ppm) ↑
Year →