Grand Rapids, Michigan: average temperature by month
The 1991–2020 normals run from 24.8 °F in January to 72.8 °F in July, a swing of 48 degrees.
What does this axis measure?
Temperature (°F)
What does this axis measure?
Month
Reveal the axesHide the axes
- y ↑
- Temperature (°F)
- x →
- Month
Show the story, the data and the sourceHide the story, the data and the source
The data: 12 points
| Month | Temperature (°F) |
|---|---|
| 1 | 24.8 |
| 2 | 26.6 |
| 3 | 35.7 |
| 4 | 47.6 |
| 5 | 59.2 |
| 6 | 68.9 |
| 7 | 72.8 |
| 8 | 71.1 |
| 9 | 63.5 |
| 10 | 51.5 |
| 11 | 40 |
| 12 | 30.4 |
- Ran in puzzle #1 on September 27, 2026. Play it
More like this
-
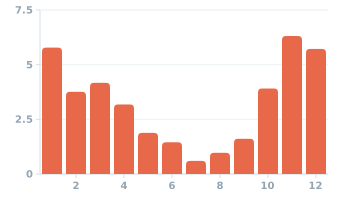 Seattle: average precipitation by month
Precipitation (inches) ↑
Month →
Seattle: average precipitation by month
Precipitation (inches) ↑
Month →
-
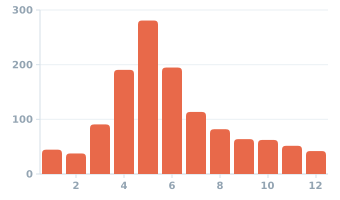 US tornadoes by month, 1995–2024 average
Tornadoes per month (count) ↑
Month →
US tornadoes by month, 1995–2024 average
Tornadoes per month (count) ↑
Month →
-
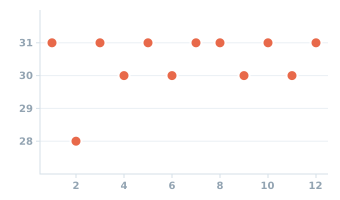 Days in each month of 2026
Days (count) ↑
Month →
Days in each month of 2026
Days (count) ↑
Month →
-
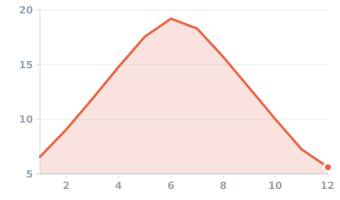 Daylight in Anchorage by month
Daylight (hours) ↑
Month →
Daylight in Anchorage by month
Daylight (hours) ↑
Month →
-
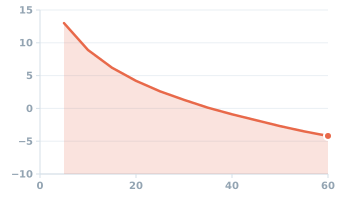 Wind chill at an air temperature of 20 °F
Wind chill (°F) ↑
Wind speed (mph) →
Wind chill at an air temperature of 20 °F
Wind chill (°F) ↑
Wind speed (mph) →
-
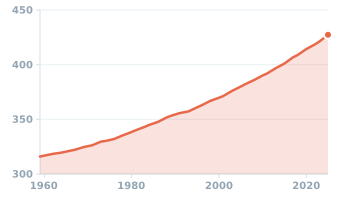 Atmospheric CO₂ at Mauna Loa, 1959–2025
CO₂ concentration (ppm) ↑
Year →
Atmospheric CO₂ at Mauna Loa, 1959–2025
CO₂ concentration (ppm) ↑
Year →