Seattle: average precipitation by month
The 1991–2020 normals give Seattle 6.3 inches in November but only 0.6 in July: 11 times as much.
What does this axis measure?
Precipitation (inches)
What does this axis measure?
Month
Reveal the axesHide the axes
- y ↑
- Precipitation (inches)
- x →
- Month
Show the story, the data and the sourceHide the story, the data and the source
The data: 12 points
| Month | Precipitation (inches) |
|---|---|
| 1 | 5.78 |
| 2 | 3.76 |
| 3 | 4.17 |
| 4 | 3.18 |
| 5 | 1.88 |
| 6 | 1.45 |
| 7 | 0.6 |
| 8 | 0.97 |
| 9 | 1.61 |
| 10 | 3.91 |
| 11 | 6.31 |
| 12 | 5.72 |
- Ran in puzzle #9 on October 5, 2026. Play it
More like this
-
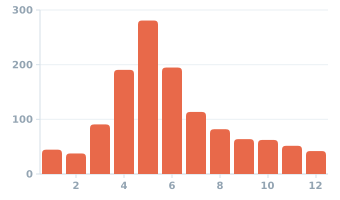 US tornadoes by month, 1995–2024 average
Tornadoes per month (count) ↑
Month →
US tornadoes by month, 1995–2024 average
Tornadoes per month (count) ↑
Month →
-
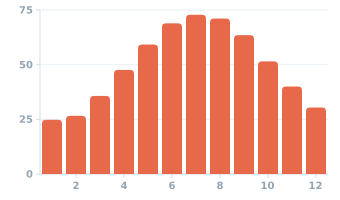 Grand Rapids, Michigan: average temperature by month
Temperature (°F) ↑
Month →
Grand Rapids, Michigan: average temperature by month
Temperature (°F) ↑
Month →
-
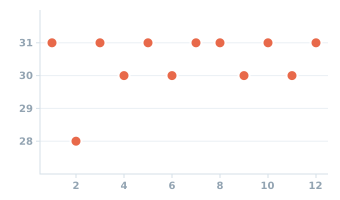 Days in each month of 2026
Days (count) ↑
Month →
Days in each month of 2026
Days (count) ↑
Month →
-
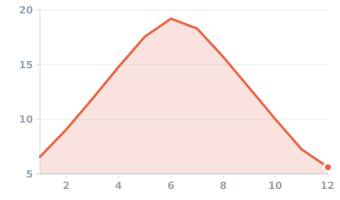 Daylight in Anchorage by month
Daylight (hours) ↑
Month →
Daylight in Anchorage by month
Daylight (hours) ↑
Month →
-
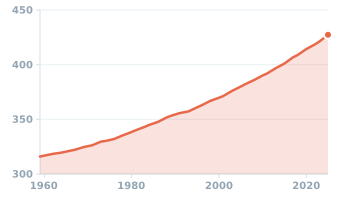 Atmospheric CO₂ at Mauna Loa, 1959–2025
CO₂ concentration (ppm) ↑
Year →
Atmospheric CO₂ at Mauna Loa, 1959–2025
CO₂ concentration (ppm) ↑
Year →
-
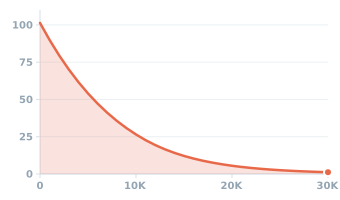 Air pressure by altitude (U.S. Standard Atmosphere)
Pressure (kPa) ↑
Altitude (m) →
Air pressure by altitude (U.S. Standard Atmosphere)
Pressure (kPa) ↑
Altitude (m) →