US households by income in 2025: those under $200,000
55% of the 137 million households had an income under $100,000. Not drawn: the 23.6 million households, 17% of all, with $200,000 or more.
What does this axis measure?
Households (millions)
What does this axis measure?
Household income ($)
Reveal the axesHide the axes
- y ↑
- Households (millions)
- x →
- Household income ($)
Show the story, the data and the sourceHide the story, the data and the source
The data: 20 points
| Household income ($) | Households (millions) |
|---|---|
| 5,000 | 5.454 |
| 15,000 | 7.871 |
| 25,000 | 8.627 |
| 35,000 | 8.742 |
| 45,000 | 8.439 |
| 55,000 | 8.684 |
| 65,000 | 7.691 |
| 75,000 | 7.493 |
| 85,000 | 6.754 |
| 95,000 | 5.962 |
| 105,000 | 6.018 |
| 115,000 | 4.993 |
| 125,000 | 4.695 |
| 135,000 | 3.96 |
| 145,000 | 3.789 |
| 155,000 | 3.728 |
| 165,000 | 3.115 |
| 175,000 | 2.859 |
| 185,000 | 2.427 |
| 195,000 | 2.118 |
- Ran in puzzle #23 on October 19, 2026. Play it
More like this
-
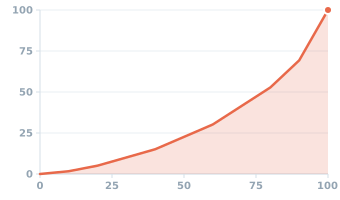 United States: how income is shared out, 2024 (Lorenz curve)
Cumulative income (%) ↑
Population, lowest income first (%) →
-
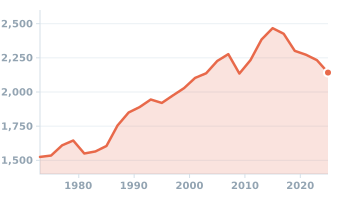 Median size of a new single-family house in the United States, 1973–2025
House size (square feet) ↑
Year →
-
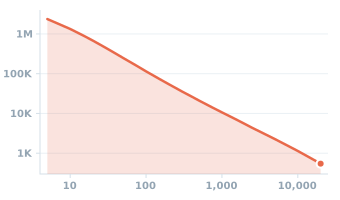 U.S. firms by size, 2022: how many have at least a given number of employees
Firms at least that size (count) ↑
Firm size (employees) →
-
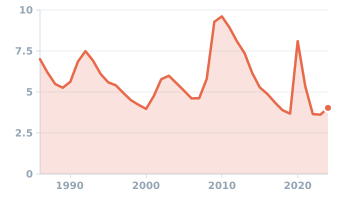 US unemployment rate, annual average, 1986–2024
Unemployment rate (%) ↑
Year →
-
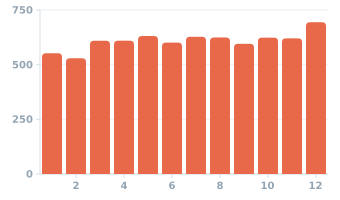 US retail sales by month, 2025
Retail sales ($ billions) ↑
Month →
-
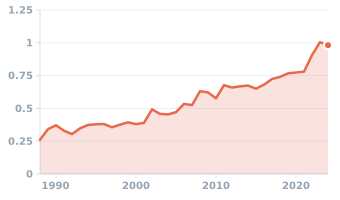 US price of a pound of potatoes, annual average, 1988–2024
Price ($/pound) ↑
Year →