Average hourly electricity demand of the whole PJM grid, January vs July 2025
On an average July day, demand peaked at 138 GW in the hour after 5 p.m.; on an average January day it rose twice, after 8 a.m. and after 6 p.m., to 116 and 117 GW.
What does this axis measure?
Electricity demand (GW)
What does this axis measure?
Time of day (hour)
Reveal the axesHide the axes
- y ↑
- Electricity demand (GW)
- x →
- Time of day (hour)
- Dots
- January → July
Show the story, the data and the sourceHide the story, the data and the source
The data: 24 points
| Time of day (hour) | Electricity demand (GW), July | Electricity demand (GW), January |
|---|---|---|
| 0 | 104.94 | 104.54 |
| 1 | 100.63 | 103.55 |
| 2 | 97 | 103.18 |
| 3 | 94.45 | 103.32 |
| 4 | 93.61 | 104.23 |
| 5 | 94.75 | 107.03 |
| 6 | 97.26 | 111.95 |
| 7 | 101.6 | 115.99 |
| 8 | 106.86 | 116.38 |
| 9 | 111.77 | 114.33 |
| 10 | 116.42 | 112.33 |
| 11 | 121.36 | 111.01 |
| 12 | 126.3 | 110.09 |
| 13 | 130.71 | 109.35 |
| 14 | 133.67 | 108.61 |
| 15 | 135.67 | 108.63 |
| 16 | 137.17 | 109.93 |
| 17 | 137.69 | 114.45 |
| 18 | 136.14 | 116.56 |
| 19 | 132.74 | 116.08 |
| 20 | 127.9 | 114.91 |
| 21 | 123.23 | 112.58 |
| 22 | 116.39 | 109.38 |
| 23 | 109.85 | 106.65 |
- Ran in puzzle #27 on October 23, 2026. Play it
More like this
-
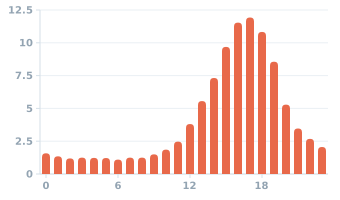 US tornadoes by time of day, 1995–2024
Share of tornadoes (%) ↑
Time of day (hour) →
-
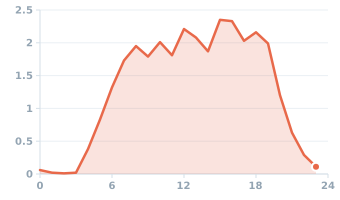 People in the U.S. playing sport or exercising, by hour of day, 2024
People doing sport or exercise (%) ↑
Time of day (hour) →
-
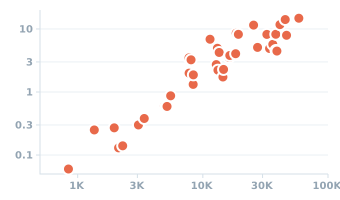 Income and CO₂ per person in the 40 most populous countries with data, 2022
CO₂ per person (metric tons) ↑
GDP per capita, PPP (intl $) →
-
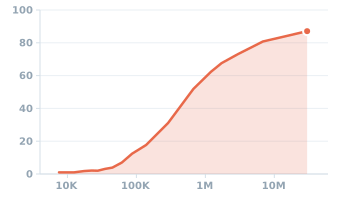 Who itemizes deductions, by income, 2023
Returns that itemize (%) ↑
Adjusted gross income ($) →
-
 Regular cover price of Action Comics, 1938–2011
Cover price ($) ↑
Issue (number) →
-
 US households by income in 2025: those under $200,000
Households (millions) ↑
Household income ($) →