Income and CO₂ per person in the 40 most populous countries with data, 2022
Among these 40 countries, emissions per person run from 0.06 metric tons a year in the Democratic Republic of the Congo to 14.8 in the United States.
What does this axis measure?
CO₂ per person (metric tons)
What does this axis measure?
GDP per capita, PPP (intl $)
Reveal the axesHide the axes
- y ↑
- CO₂ per person (metric tons)
- x →
- GDP per capita, PPP (intl $)
Show the story, the data and the sourceHide the story, the data and the source
The data: 40 points
| GDP per capita, PPP (intl $) | CO₂ per person (metric tons) |
|---|---|
| 844 | 0.06 |
| 1,358 | 0.25 |
| 1,959 | 0.27 |
| 2,122 | 0.13 |
| 2,289 | 0.14 |
| 3,057 | 0.3 |
| 3,404 | 0.38 |
| 4,926 | 0.6 |
| 5,070 | 0.59 |
| 5,177 | 0.59 |
| 5,532 | 0.87 |
| 7,749 | 3.48 |
| 7,766 | 1.99 |
| 8,050 | 3.24 |
| 8,371 | 1.32 |
| 8,400 | 1.87 |
| 11,416 | 6.87 |
| 12,802 | 2.72 |
| 13,072 | 4.94 |
| 13,205 | 2.22 |
| 13,506 | 4.24 |
| 14,469 | 1.73 |
| 14,640 | 2.28 |
| 16,235 | 3.53 |
| 16,421 | 3.8 |
| 18,292 | 4.05 |
| 18,473 | 8.57 |
| 19,238 | 8.22 |
| 25,437 | 11.51 |
| 27,362 | 5.1 |
| 32,468 | 8.2 |
| 34,123 | 4.9 |
| 36,224 | 5.7 |
| 38,269 | 8.24 |
| 38,407 | 4.56 |
| 39,066 | 4.46 |
| 41,321 | 11.72 |
| 45,530 | 14.11 |
| 46,648 | 7.94 |
| 58,487 | 14.8 |
- Ran in puzzle #26 on October 22, 2026. Play it
More like this
-
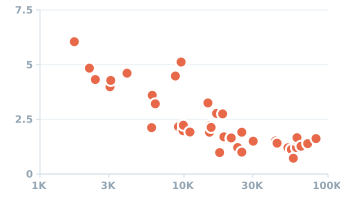 GDP per capita and births per woman in the 40 most populous countries, 2023
Fertility (births per woman) ↑
GDP per capita, PPP (intl $) →
-
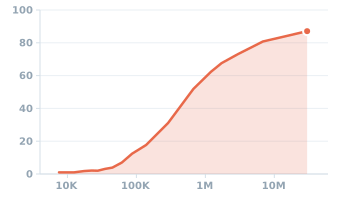 Who itemizes deductions, by income, 2023
Returns that itemize (%) ↑
Adjusted gross income ($) →
-
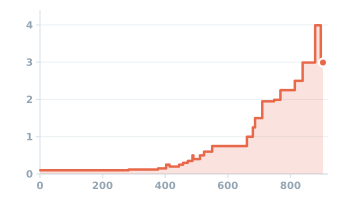 Regular cover price of Action Comics, 1938–2011
Cover price ($) ↑
Issue (number) →
-
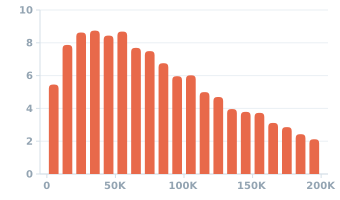 US households by income in 2025: those under $200,000
Households (millions) ↑
Household income ($) →
-
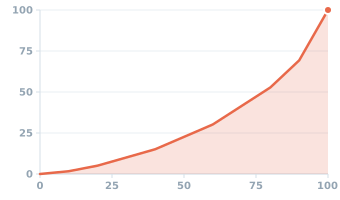 United States: how income is shared out, 2024 (Lorenz curve)
Cumulative income (%) ↑
Population, lowest income first (%) →
-
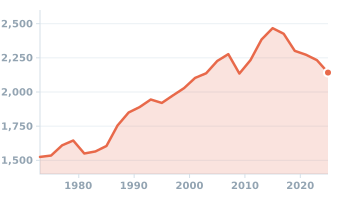 Median size of a new single-family house in the United States, 1973–2025
House size (square feet) ↑
Year →