HbA1c and average sensor glucose in 40 adults
The adults on the chart with an HbA1c of 5.2% averaged anywhere from 88 to 117 mg/dL on their sensors.
What does this axis measure?
Average glucose (mg/dL)
What does this axis measure?
HbA1c (%)
Reveal the axesHide the axes
- y ↑
- Average glucose (mg/dL)
- x →
- HbA1c (%)
Show the story, the data and the sourceHide the story, the data and the source
The data: 40 points
| HbA1c (%) | Average glucose (mg/dL) |
|---|---|
| 4.6 | 91 |
| 4.9 | 89 |
| 4.9 | 108 |
| 5 | 79 |
| 5 | 102 |
| 5.1 | 75 |
| 5.1 | 88 |
| 5.1 | 97 |
| 5.1 | 109 |
| 5.2 | 88 |
| 5.2 | 91 |
| 5.2 | 91 |
| 5.2 | 94 |
| 5.2 | 95 |
| 5.2 | 100 |
| 5.2 | 108 |
| 5.2 | 117 |
| 5.3 | 87 |
| 5.3 | 89 |
| 5.3 | 92 |
| 5.3 | 96 |
| 5.3 | 107 |
| 5.4 | 87 |
| 5.4 | 97 |
| 5.4 | 98 |
| 5.4 | 101 |
| 5.5 | 99 |
| 5.5 | 107 |
| 5.5 | 108 |
| 5.5 | 109 |
| 5.6 | 107 |
| 5.6 | 110 |
| 5.7 | 98 |
| 5.8 | 103 |
| 5.9 | 99 |
| 6 | 120 |
| 6.2 | 108 |
| 6.2 | 109 |
| 6.5 | 106 |
| 6.7 | 122 |
- Ran in puzzle #25 on October 21, 2026. Play it
More like this
-
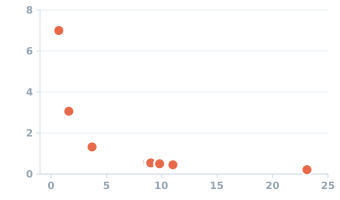 A superhero's leap: the same jump on the Moon, the planets and Pluto
Jump height (m) ↑
Surface gravity (m/s²) →
-
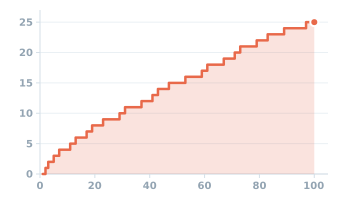 Counting the prime numbers from 1 up to 100
Primes so far (count) ↑
Counting up to (number) →
-
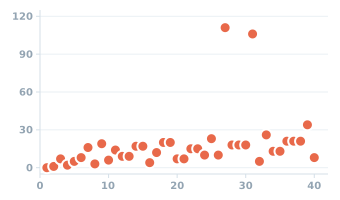 Halve it if even, triple it and add 1 if odd: how long until you reach 1?
Steps to reach 1 (count) ↑
Starting number (value) →
-
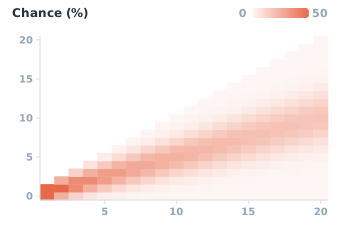 The chance of each number of heads in up to 20 tosses of a fair coin
Heads (count) ↑
Tosses (count) →
-
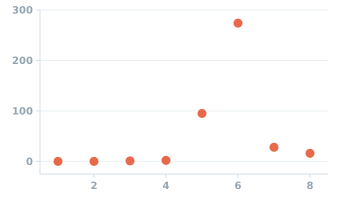 Known moons of the eight planets (NASA fact sheet, March 2025)
Known moons (count) ↑
Planet (order from the Sun) →
-
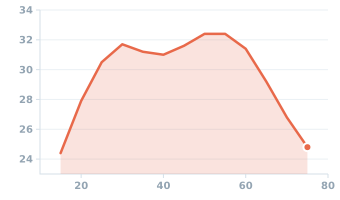 Fuel economy at steady speeds: average of 9 cars and light trucks, 1997 study
Fuel economy (miles per gallon) ↑
Driving speed (mph) →