Fuel economy at steady speeds: average of 9 cars and light trucks, 1997 study
The 9 vehicles did best at 50 to 55 mph, with 32.4 miles per gallon. At 75 mph they got 24.8, 23% less: about what they got crawling at 15 mph (24.4).
What does this axis measure?
Fuel economy (miles per gallon)
What does this axis measure?
Driving speed (mph)
Reveal the axesHide the axes
- y ↑
- Fuel economy (miles per gallon)
- x →
- Driving speed (mph)
Show the story, the data and the sourceHide the story, the data and the source
The data: 13 points
| Driving speed (mph) | Fuel economy (miles per gallon) |
|---|---|
| 15 | 24.4 |
| 20 | 27.9 |
| 25 | 30.5 |
| 30 | 31.7 |
| 35 | 31.2 |
| 40 | 31 |
| 45 | 31.6 |
| 50 | 32.4 |
| 55 | 32.4 |
| 60 | 31.4 |
| 65 | 29.2 |
| 70 | 26.8 |
| 75 | 24.8 |
- Ran in puzzle #20 on October 16, 2026. Play it
More like this
-
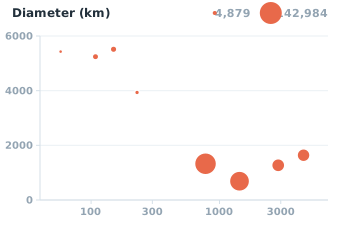 The eight planets: distance from the Sun vs density, drawn by diameter
Density (kg/m³) ↑
Distance from the Sun (million km) →
The eight planets: distance from the Sun vs density, drawn by diameter
Density (kg/m³) ↑
Distance from the Sun (million km) →
-
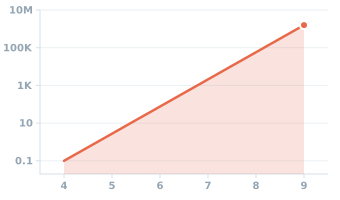 Estimated energy released by an earthquake, by magnitude
Energy released (terajoules) ↑
Magnitude →
Estimated energy released by an earthquake, by magnitude
Energy released (terajoules) ↑
Magnitude →
-
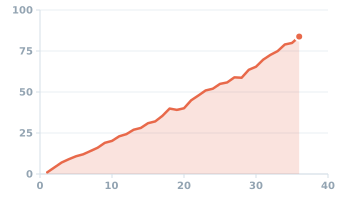 Atomic mass of the elements, hydrogen to krypton
Atomic mass (u) ↑
Atomic number (protons) →
Atomic mass of the elements, hydrogen to krypton
Atomic mass (u) ↑
Atomic number (protons) →
-
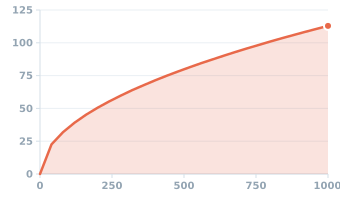 Distance to the horizon by height above the sea
Distance to horizon (km) ↑
Height above the sea (m) →
Distance to the horizon by height above the sea
Distance to horizon (km) ↑
Height above the sea (m) →
-
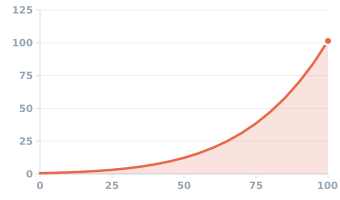 Vapor pressure of water by temperature
Vapor pressure (kPa) ↑
Temperature (°C) →
Vapor pressure of water by temperature
Vapor pressure (kPa) ↑
Temperature (°C) →
-
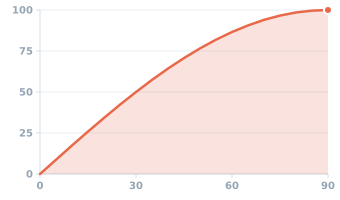 Sunlight on level ground by the height of the Sun, the air's dimming left out
Sunlight strength (%) ↑
Sun height (degrees) →
Sunlight on level ground by the height of the Sun, the air's dimming left out
Sunlight strength (%) ↑
Sun height (degrees) →