The chance of each number of heads in up to 20 tosses of a fair coin
In 20 tosses, 10 heads is the likeliest count, yet it comes up only 17.6% of the time. All 20 heads is 1 chance in 1,048,576.
What does this axis measure?
Heads (count)
What does this axis measure?
Tosses (count)
Reveal the axesHide the axes
- y ↑
- Heads (count)
- x →
- Tosses (count)
- Given
- Chance (%)
Show the story, the data and the sourceHide the story, the data and the source
The data: 230 points
| Tosses (count) | Heads (count) | Chance (%) |
|---|---|---|
| 1 | 0 | 50 |
| 2 | 0 | 25 |
| 3 | 0 | 12.5 |
| 4 | 0 | 6.25 |
| 5 | 0 | 3.12 |
| 6 | 0 | 1.56 |
| 7 | 0 | 0.78 |
| 8 | 0 | 0.39 |
| 9 | 0 | 0.2 |
| 10 | 0 | 0.1 |
| 11 | 0 | 0.05 |
| 12 | 0 | 0.02 |
| 13 | 0 | 0.01 |
| 14 | 0 | 0.01 |
| 15 | 0 | 0 |
| 16 | 0 | 0 |
| 17 | 0 | 0 |
| 18 | 0 | 0 |
| 19 | 0 | 0 |
| 20 | 0 | 0 |
| 1 | 1 | 50 |
| 2 | 1 | 50 |
| 3 | 1 | 37.5 |
| 4 | 1 | 25 |
| 5 | 1 | 15.62 |
| 6 | 1 | 9.38 |
| 7 | 1 | 5.47 |
| 8 | 1 | 3.12 |
| 9 | 1 | 1.76 |
| 10 | 1 | 0.98 |
| 11 | 1 | 0.54 |
| 12 | 1 | 0.29 |
| 13 | 1 | 0.16 |
| 14 | 1 | 0.09 |
| 15 | 1 | 0.05 |
| 16 | 1 | 0.02 |
| 17 | 1 | 0.01 |
| 18 | 1 | 0.01 |
| 19 | 1 | 0 |
| 20 | 1 | 0 |
| 2 | 2 | 25 |
| 3 | 2 | 37.5 |
| 4 | 2 | 37.5 |
| 5 | 2 | 31.25 |
| 6 | 2 | 23.44 |
| 7 | 2 | 16.41 |
| 8 | 2 | 10.94 |
| 9 | 2 | 7.03 |
| 10 | 2 | 4.39 |
| 11 | 2 | 2.69 |
| 12 | 2 | 1.61 |
| 13 | 2 | 0.95 |
| 14 | 2 | 0.56 |
| 15 | 2 | 0.32 |
| 16 | 2 | 0.18 |
| 17 | 2 | 0.1 |
| 18 | 2 | 0.06 |
| 19 | 2 | 0.03 |
| 20 | 2 | 0.02 |
| 3 | 3 | 12.5 |
| 4 | 3 | 25 |
| 5 | 3 | 31.25 |
| 6 | 3 | 31.25 |
| 7 | 3 | 27.34 |
| 8 | 3 | 21.88 |
| 9 | 3 | 16.41 |
| 10 | 3 | 11.72 |
| 11 | 3 | 8.06 |
| 12 | 3 | 5.37 |
| 13 | 3 | 3.49 |
| 14 | 3 | 2.22 |
| 15 | 3 | 1.39 |
| 16 | 3 | 0.85 |
| 17 | 3 | 0.52 |
| 18 | 3 | 0.31 |
| 19 | 3 | 0.18 |
| 20 | 3 | 0.11 |
| 4 | 4 | 6.25 |
| 5 | 4 | 15.62 |
| 6 | 4 | 23.44 |
| 7 | 4 | 27.34 |
| 8 | 4 | 27.34 |
| 9 | 4 | 24.61 |
| 10 | 4 | 20.51 |
| 11 | 4 | 16.11 |
| 12 | 4 | 12.08 |
| 13 | 4 | 8.73 |
| 14 | 4 | 6.11 |
| 15 | 4 | 4.17 |
| 16 | 4 | 2.78 |
| 17 | 4 | 1.82 |
| 18 | 4 | 1.17 |
| 19 | 4 | 0.74 |
| 20 | 4 | 0.46 |
| 5 | 5 | 3.12 |
| 6 | 5 | 9.38 |
| 7 | 5 | 16.41 |
| 8 | 5 | 21.88 |
| 9 | 5 | 24.61 |
| 10 | 5 | 24.61 |
| 11 | 5 | 22.56 |
| 12 | 5 | 19.34 |
| 13 | 5 | 15.71 |
| 14 | 5 | 12.22 |
| 15 | 5 | 9.16 |
| 16 | 5 | 6.67 |
| 17 | 5 | 4.72 |
| 18 | 5 | 3.27 |
| 19 | 5 | 2.22 |
| 20 | 5 | 1.48 |
| 6 | 6 | 1.56 |
| 7 | 6 | 5.47 |
| 8 | 6 | 10.94 |
| 9 | 6 | 16.41 |
| 10 | 6 | 20.51 |
| 11 | 6 | 22.56 |
| 12 | 6 | 22.56 |
| 13 | 6 | 20.95 |
| 14 | 6 | 18.33 |
| 15 | 6 | 15.27 |
| 16 | 6 | 12.22 |
| 17 | 6 | 9.44 |
| 18 | 6 | 7.08 |
| 19 | 6 | 5.18 |
| 20 | 6 | 3.7 |
| 7 | 7 | 0.78 |
| 8 | 7 | 3.12 |
| 9 | 7 | 7.03 |
| 10 | 7 | 11.72 |
| 11 | 7 | 16.11 |
| 12 | 7 | 19.34 |
| 13 | 7 | 20.95 |
| 14 | 7 | 20.95 |
| 15 | 7 | 19.64 |
| 16 | 7 | 17.46 |
| 17 | 7 | 14.84 |
| 18 | 7 | 12.14 |
| 19 | 7 | 9.61 |
| 20 | 7 | 7.39 |
| 8 | 8 | 0.39 |
| 9 | 8 | 1.76 |
| 10 | 8 | 4.39 |
| 11 | 8 | 8.06 |
| 12 | 8 | 12.08 |
| 13 | 8 | 15.71 |
| 14 | 8 | 18.33 |
| 15 | 8 | 19.64 |
| 16 | 8 | 19.64 |
| 17 | 8 | 18.55 |
| 18 | 8 | 16.69 |
| 19 | 8 | 14.42 |
| 20 | 8 | 12.01 |
| 9 | 9 | 0.2 |
| 10 | 9 | 0.98 |
| 11 | 9 | 2.69 |
| 12 | 9 | 5.37 |
| 13 | 9 | 8.73 |
| 14 | 9 | 12.22 |
| 15 | 9 | 15.27 |
| 16 | 9 | 17.46 |
| 17 | 9 | 18.55 |
| 18 | 9 | 18.55 |
| 19 | 9 | 17.62 |
| 20 | 9 | 16.02 |
| 10 | 10 | 0.1 |
| 11 | 10 | 0.54 |
| 12 | 10 | 1.61 |
| 13 | 10 | 3.49 |
| 14 | 10 | 6.11 |
| 15 | 10 | 9.16 |
| 16 | 10 | 12.22 |
| 17 | 10 | 14.84 |
| 18 | 10 | 16.69 |
| 19 | 10 | 17.62 |
| 20 | 10 | 17.62 |
| 11 | 11 | 0.05 |
| 12 | 11 | 0.29 |
| 13 | 11 | 0.95 |
| 14 | 11 | 2.22 |
| 15 | 11 | 4.17 |
| 16 | 11 | 6.67 |
| 17 | 11 | 9.44 |
| 18 | 11 | 12.14 |
| 19 | 11 | 14.42 |
| 20 | 11 | 16.02 |
| 12 | 12 | 0.02 |
| 13 | 12 | 0.16 |
| 14 | 12 | 0.56 |
| 15 | 12 | 1.39 |
| 16 | 12 | 2.78 |
| 17 | 12 | 4.72 |
| 18 | 12 | 7.08 |
| 19 | 12 | 9.61 |
| 20 | 12 | 12.01 |
| 13 | 13 | 0.01 |
| 14 | 13 | 0.09 |
| 15 | 13 | 0.32 |
| 16 | 13 | 0.85 |
| 17 | 13 | 1.82 |
| 18 | 13 | 3.27 |
| 19 | 13 | 5.18 |
| 20 | 13 | 7.39 |
| 14 | 14 | 0.01 |
| 15 | 14 | 0.05 |
| 16 | 14 | 0.18 |
| 17 | 14 | 0.52 |
| 18 | 14 | 1.17 |
| 19 | 14 | 2.22 |
| 20 | 14 | 3.7 |
| 15 | 15 | 0 |
| 16 | 15 | 0.02 |
| 17 | 15 | 0.1 |
| 18 | 15 | 0.31 |
| 19 | 15 | 0.74 |
| 20 | 15 | 1.48 |
| 16 | 16 | 0 |
| 17 | 16 | 0.01 |
| 18 | 16 | 0.06 |
| 19 | 16 | 0.18 |
| 20 | 16 | 0.46 |
| 17 | 17 | 0 |
| 18 | 17 | 0.01 |
| 19 | 17 | 0.03 |
| 20 | 17 | 0.11 |
| 18 | 18 | 0 |
| 19 | 18 | 0 |
| 20 | 18 | 0.02 |
| 19 | 19 | 0 |
| 20 | 19 | 0 |
| 20 | 20 | 0 |
- Ran in puzzle #22 on October 18, 2026. Play it
More like this
-
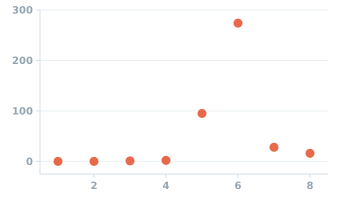 Known moons of the eight planets (NASA fact sheet, March 2025)
Known moons (count) ↑
Planet (order from the Sun) →
-
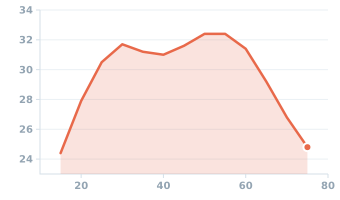 Fuel economy at steady speeds: average of 9 cars and light trucks, 1997 study
Fuel economy (miles per gallon) ↑
Driving speed (mph) →
-
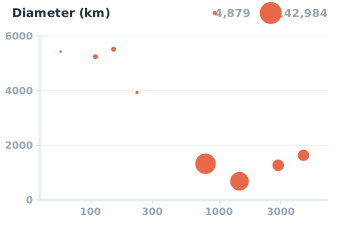 The eight planets: distance from the Sun vs density, drawn by diameter
Density (kg/m³) ↑
Distance from the Sun (million km) →
-
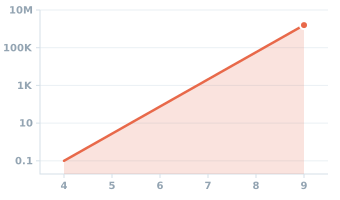 Estimated energy released by an earthquake, by magnitude
Energy released (terajoules) ↑
Magnitude →
-
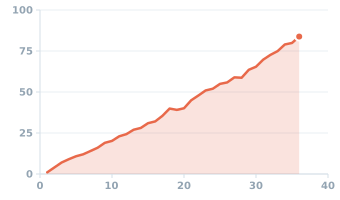 Atomic mass of the elements, hydrogen to krypton
Atomic mass (u) ↑
Atomic number (protons) →
-
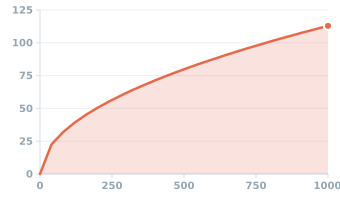 Distance to the horizon by height above the sea
Distance to horizon (km) ↑
Height above the sea (m) →