Tour de France, 1980–2026: route length and the winner's speed over it
Speeds here are the route length divided by the winner's time. The shortest route, 3,245 km in 2026, gives 43.9 km/h; the longest, 4,231 km in 1987, 36.6.
What does this axis measure?
Winner's average speed (km/h)
What does this axis measure?
Route length (km)
Reveal the axesHide the axes
- y ↑
- Winner's average speed (km/h)
- x →
- Route length (km)
Show the story, the data and the sourceHide the story, the data and the source
The data: 40 points
| Route length (km) | Winner's average speed (km/h) |
|---|---|
| 3245 | 43.89 |
| 3285 | 37.48 |
| 3286 | 38.9 |
| 3320 | 43.68 |
| 3328 | 41.84 |
| 3349 | 40.21 |
| 3360.3 | 39.64 |
| 3366 | 40.58 |
| 3404 | 40.55 |
| 3406 | 41.49 |
| 3414.4 | 41.17 |
| 3430 | 39.79 |
| 3459 | 40.31 |
| 3484 | 39.89 |
| 3496 | 39.92 |
| 3498 | 41.82 |
| 3504 | 38.62 |
| 3507 | 38.06 |
| 3529 | 39.62 |
| 3540 | 41 |
| 3559 | 40.5 |
| 3570 | 39.23 |
| 3635 | 39.19 |
| 3642 | 39.59 |
| 3657 | 40.78 |
| 3660.5 | 40.68 |
| 3714 | 38.71 |
| 3753 | 38.96 |
| 3765 | 39.24 |
| 3809 | 36.23 |
| 3842 | 35.14 |
| 3875 | 41.74 |
| 3914 | 38.74 |
| 3950 | 39.3 |
| 3978 | 38.38 |
| 3983 | 39.5 |
| 4021 | 35.88 |
| 4094 | 37.02 |
| 4109 | 36.23 |
| 4231 | 36.64 |
- Ran in puzzle #32 on October 28, 2026. Play it
More like this
-
 Balls of 12 sports: size and mass, middle of each rule book's range
Mass (g) ↑
Circumference (cm) →
-
 Summer Olympics: athletes and women's share, 1896–2024
Women among competitors (%) ↑
Athletes (thousands) →
-
 NBA games since 1963, by attendance
Games (count) ↑
Attendance (people) →
-
 Tennis: the chance of winning a game, by the chance of winning each point
Chance of winning the game (%) ↑
Chance of winning a point (%) →
-
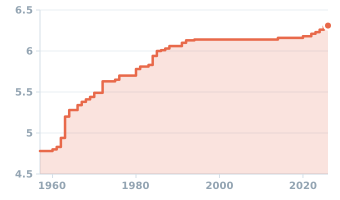 Men's pole vault world record, 1957–2026
Bar height (m) ↑
Year →
-
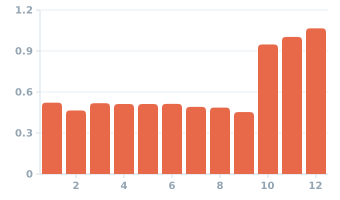 Major League Baseball, 2023–2025: runs per half-inning, by inning
Runs per half-inning (runs) ↑
Inning (number) →