A day in the life of a tree trunk: Lebanon cedars in Turkey, summers 2013–2014
On a summer day these cedar trunks are fattest around 6 am and thinnest around 4 pm: they shrink by 0.11 mm, about the thickness of a hair, as the needles lose water faster than the roots take it up.
What does this axis measure?
Trunk radius vs. daily average (mm)
What does this axis measure?
Time of day (hour)
Reveal the axesHide the axes
- y ↑
- Trunk radius vs. daily average (mm)
- x →
- Time of day (hour)
Show the story, the data and the sourceHide the story, the data and the source
The data: 24 points
| Time of day (hour) | Trunk radius vs. daily average (mm) |
|---|---|
| 0 | 0.0238 |
| 1 | 0.0293 |
| 2 | 0.0344 |
| 3 | 0.0395 |
| 4 | 0.0437 |
| 5 | 0.0476 |
| 6 | 0.0488 |
| 7 | 0.0446 |
| 8 | 0.035 |
| 9 | 0.0223 |
| 10 | 0.0055 |
| 11 | −0.0152 |
| 12 | −0.0341 |
| 13 | −0.0468 |
| 14 | −0.055 |
| 15 | −0.0578 |
| 16 | −0.0589 |
| 17 | −0.0557 |
| 18 | −0.0437 |
| 19 | −0.0282 |
| 20 | −0.0117 |
| 21 | 0.0016 |
| 22 | 0.0113 |
| 23 | 0.0196 |
- Ran in puzzle #48 on November 13, 2026. Play it
More like this
-
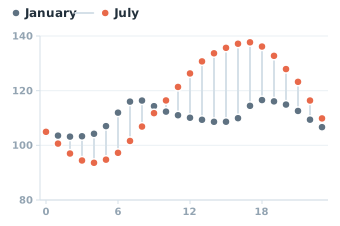 Average hourly electricity demand of the whole PJM grid, January vs July 2025
Electricity demand (GW) ↑
Time of day (hour) →
-
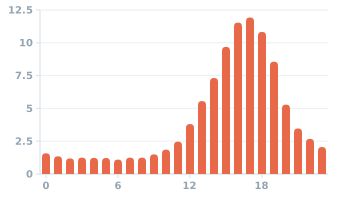 US tornadoes by time of day, 1995–2024
Share of tornadoes (%) ↑
Time of day (hour) →
-
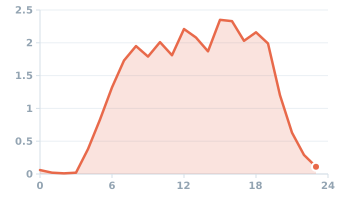 People in the U.S. playing sport or exercising, by hour of day, 2024
People doing sport or exercise (%) ↑
Time of day (hour) →
-
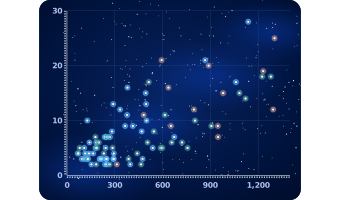 The 88 constellations: area on the sky and stars in the stick figure
Stars in the stick figure (count) ↑
Constellation area (square degrees) →
-
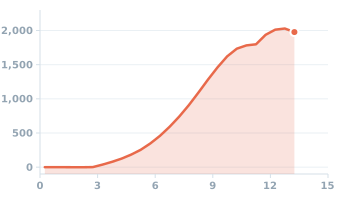 One wind turbine's output by wind speed, Kelmarsh, England, May–December 2016
Electric power output (kW) ↑
Wind speed at the turbine (m/s) →
-
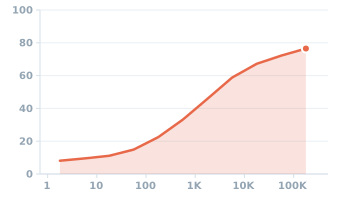 Natural causes' share of US wildfires by final size, 1992–2024
Natural-caused fires (%) ↑
Fire size (acres) →