House seats and residents of the 50 states, 2020 census
California has the most House seats, 52 of 435; 6 states have just one.
What does this axis measure?
House seats (count)
What does this axis measure?
Residents (millions)
Reveal the axesHide the axes
- y ↑
- House seats (count)
- x →
- Residents (millions)
Show the story, the data and the sourceHide the story, the data and the source
The data: 50 points
| Residents (millions) | House seats (count) |
|---|---|
| 0.58 | 1 |
| 0.64 | 1 |
| 0.73 | 1 |
| 0.78 | 1 |
| 0.89 | 1 |
| 0.99 | 1 |
| 1.08 | 2 |
| 1.1 | 2 |
| 1.36 | 2 |
| 1.38 | 2 |
| 1.46 | 2 |
| 1.79 | 2 |
| 1.84 | 2 |
| 1.96 | 3 |
| 2.12 | 3 |
| 2.94 | 4 |
| 2.96 | 4 |
| 3.01 | 4 |
| 3.1 | 4 |
| 3.19 | 4 |
| 3.27 | 4 |
| 3.61 | 5 |
| 3.96 | 5 |
| 4.24 | 6 |
| 4.51 | 6 |
| 4.66 | 6 |
| 5.02 | 7 |
| 5.12 | 7 |
| 5.71 | 8 |
| 5.77 | 8 |
| 5.89 | 8 |
| 6.15 | 8 |
| 6.18 | 8 |
| 6.79 | 9 |
| 6.91 | 9 |
| 7.03 | 9 |
| 7.15 | 9 |
| 7.71 | 10 |
| 8.63 | 11 |
| 9.29 | 12 |
| 10.08 | 13 |
| 10.44 | 14 |
| 10.71 | 14 |
| 11.8 | 15 |
| 12.81 | 17 |
| 13 | 17 |
| 20.2 | 26 |
| 21.54 | 28 |
| 29.15 | 38 |
| 39.54 | 52 |
- Ran in puzzle #38 on November 3, 2026. Play it
More like this
-
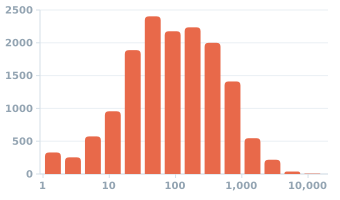 LEGO building sets by number of pieces, through 2025
Sets (count) ↑
Pieces per set (count) →
-
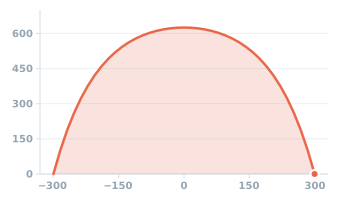 The curve of the Gateway Arch in St. Louis, along the middle of its legs
Height (feet) ↑
Distance from the center (feet) →
-
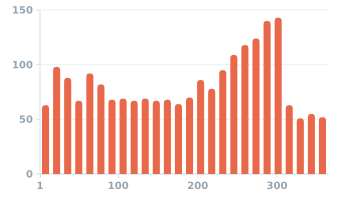 Horror films by the time of year they first came out, 2000–2024
Horror films (count) ↑
Day of year →
-
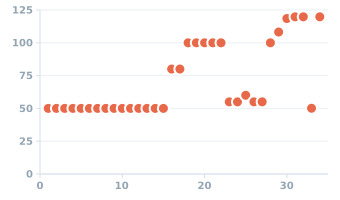 Godzilla's height in Toho's live-action and Monsterverse films, 1954–2024
Height (m) ↑
Film in the series (1 = 1954) →
-
 Dracula: how often the word "blood" appears in each of its 27 chapters
Uses of the word "blood" (count) ↑
Chapter (number) →
-
 Rangsk's NYT crossword solve time by weekday, April 2024–October 2026
Solve time (minutes) ↑
Day of the week (1 = Monday) →