California's seats in the U.S. House after each census since 1910
California had 11 House seats after the 1910 census and a peak of 53 after 2000. The 2020 census cut it to 52 of 435, its first lost seat since 1910.
What does this axis measure?
California's House seats (count)
What does this axis measure?
Year
Reveal the axesHide the axes
- y ↑
- California's House seats (count)
- x →
- Year
Show the story, the data and the sourceHide the story, the data and the source
The data: 12 points
| Year | California's House seats (count) |
|---|---|
| 1910 | 11 |
| 1920 | 11 |
| 1930 | 20 |
| 1940 | 23 |
| 1950 | 30 |
| 1960 | 38 |
| 1970 | 43 |
| 1980 | 45 |
| 1990 | 52 |
| 2000 | 53 |
| 2010 | 53 |
| 2020 | 52 |
- Ran in puzzle #52 on November 17, 2026. Play it
More like this
-
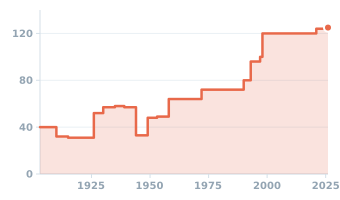 Crayola crayon colors in production, 1903–2026
Crayola colors made (count) ↑
Year →
-
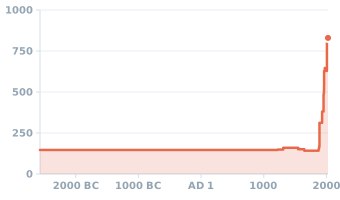 The tallest structure on land, about 2570 BC to 2025
Tallest structure (m) ↑
Year →
-
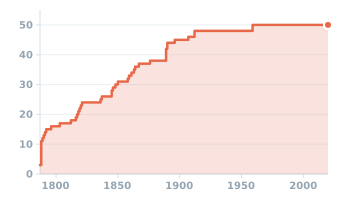 U.S. states by year of ratification or admission, 1787–2020
States (count) ↑
Year →
-
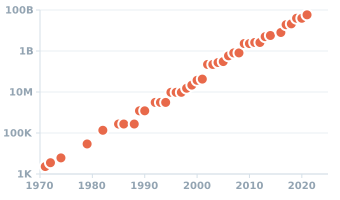 Moore's law: transistors per microprocessor, 1971–2021
Transistors (count) ↑
Year →
-
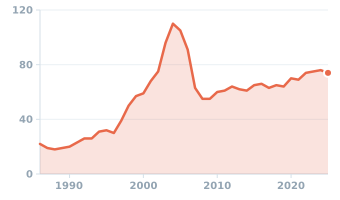 Colors in each year's LEGO sets, 1986–2025
Brick colors in use (count) ↑
Year →
-
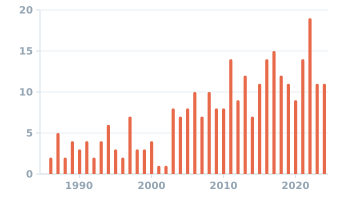 Superhero films released each year, 1985–2024
Superhero films (count) ↑
Year →